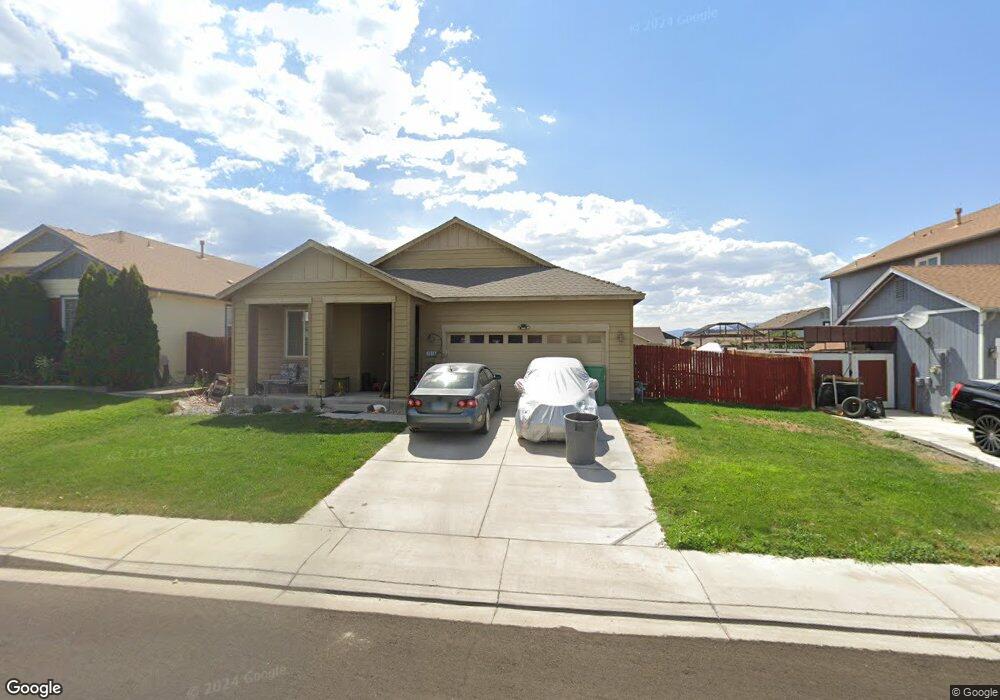
1518 Crestview Rd Fernley, NV 89408
Estimated Value: $361,005 - $375,000
3
Beds
2
Baths
1,413
Sq Ft
$260/Sq Ft
Est. Value
About This Home
This home is located at 1518 Crestview Rd, Fernley, NV 89408 and is currently estimated at $367,501, approximately $260 per square foot. 1518 Crestview Rd is a home located in Lyon County with nearby schools including Cottonwood Elementary School, Fernley Intermediate School, and Fernley High School.
Ownership History
Date
Name
Owned For
Owner Type
Purchase Details
Closed on
Aug 19, 2009
Sold by
Greenough I Llc Of The Greenough Llc
Bought by
Christiansen Jeffery L and Christiansen Jill L
Current Estimated Value
Purchase Details
Closed on
Jan 16, 2009
Sold by
Us Bank National Association
Bought by
Greenough I Llc
Purchase Details
Closed on
Jul 14, 2008
Sold by
Mendoza Ramiro and Villasenor Angela
Bought by
U S Bank Na and Structured Asset Securities Corp Mtg Loa
Purchase Details
Closed on
Dec 22, 2005
Sold by
Fernley Ponderosa Llc
Bought by
Mendoza Ramiro and Villasenor Angela
Home Financials for this Owner
Home Financials are based on the most recent Mortgage that was taken out on this home.
Original Mortgage
$189,926
Interest Rate
8.25%
Mortgage Type
Adjustable Rate Mortgage/ARM
Create a Home Valuation Report for This Property
The Home Valuation Report is an in-depth analysis detailing your home's value as well as a comparison with similar homes in the area
Home Values in the Area
Average Home Value in this Area
Purchase History
| Date | Buyer | Sale Price | Title Company |
|---|---|---|---|
| Christiansen Jeffery L | -- | None Available | |
| Greenough I Llc | $103,000 | Ticor Title Reno | |
| Us Bank National Association | $103,000 | Ticor Title Reno | |
| U S Bank Na | $145,000 | Lsi | |
| Mendoza Ramiro | $237,408 | Western Title Company |
Source: Public Records
Mortgage History
| Date | Status | Borrower | Loan Amount |
|---|---|---|---|
| Previous Owner | Mendoza Ramiro | $189,926 |
Source: Public Records
Tax History Compared to Growth
Tax History
| Year | Tax Paid | Tax Assessment Tax Assessment Total Assessment is a certain percentage of the fair market value that is determined by local assessors to be the total taxable value of land and additions on the property. | Land | Improvement |
|---|---|---|---|---|
| 2025 | $1,877 | $105,351 | $43,750 | $61,601 |
| 2024 | $2,232 | $105,757 | $43,750 | $62,006 |
| 2023 | $2,232 | $101,803 | $43,750 | $58,053 |
| 2022 | $2,024 | $97,125 | $43,750 | $53,375 |
| 2021 | $2,002 | $82,821 | $30,800 | $52,021 |
| 2020 | $1,881 | $80,648 | $30,800 | $49,848 |
| 2019 | $1,806 | $76,134 | $28,000 | $48,134 |
| 2018 | $1,744 | $67,907 | $21,000 | $46,907 |
| 2017 | $1,724 | $60,007 | $13,130 | $46,877 |
| 2016 | $1,536 | $48,925 | $5,780 | $43,145 |
| 2015 | $1,571 | $33,280 | $5,780 | $27,500 |
| 2014 | $1,534 | $31,231 | $5,780 | $25,451 |
Source: Public Records
Map
Nearby Homes
- 1616 Laverder Dr
- 1353 Winnies Ln
- 1315 Winnies Ln
- 1625 Picetti Way
- 1740 Johns Cir
- 1409 Jennys Ln
- 1671 Vista Moon Ct
- 1165 Jenny's Ln
- 27 Simons Rd
- 20 Simons Rd
- 1285 Camille Dr
- 1300 Rancho Rd
- 28 Simons Rd
- 18 Barnes Ct
- 0 Spring Rd Unit APN 021-304-30
- 1405 Buckboard Way
- 1075 Browne Ln
- 021 46103
- APN 021-191-08
- 1340 Nevada Pacific Blvd
- 1518 Crest View Rd
- 1520 Crest View Rd
- 1520 Crestview Rd
- 1516 Crestview Rd
- 1516 Crest View Rd
- 1609 Laverder Dr
- 1522 Crest View Rd
- 1522 Crestview Rd
- 1607 Laverder Dr
- 1514 Crest View Rd
- 1613 Laverder Dr
- 1521 Crest View Rd
- 1523 Crestview Rd
- 1523 Crest View Rd
- 1519 Crestview Rd
- 1519 Crest View Rd
- 1521 Crestview Rd
- 1524 Crestview Rd
- 1605 Laverder Dr
- 1615 Laverder Dr