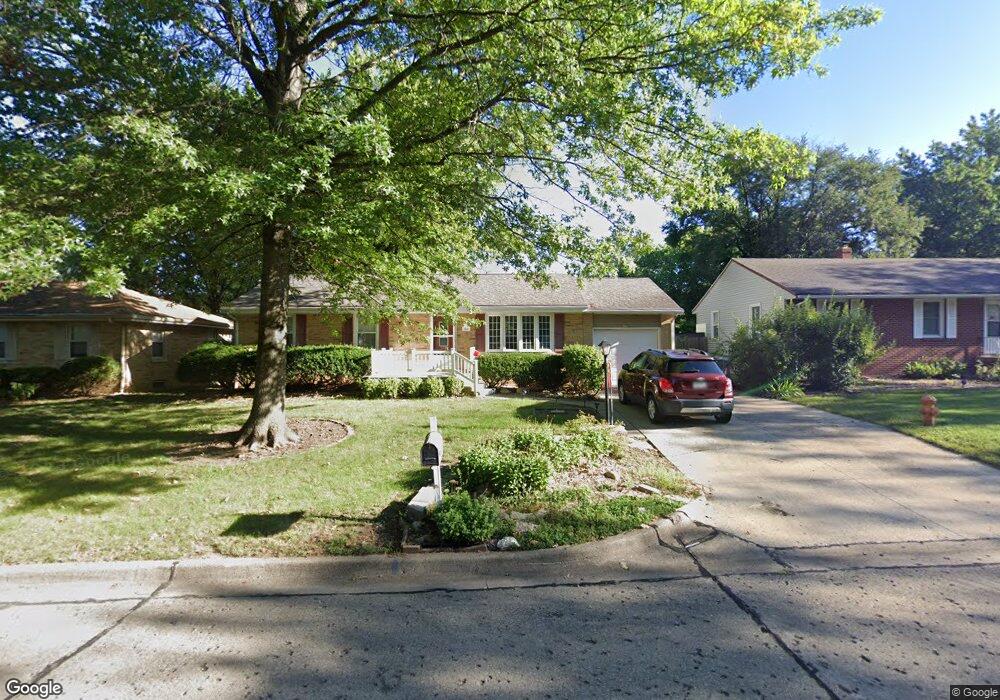
1518 W Charles St Champaign, IL 61821
Estimated Value: $154,000 - $233,000
--
Bed
2
Baths
1,580
Sq Ft
$123/Sq Ft
Est. Value
About This Home
This home is located at 1518 W Charles St, Champaign, IL 61821 and is currently estimated at $194,875, approximately $123 per square foot. 1518 W Charles St is a home located in Champaign County with nearby schools including Centennial High School, St. John Lutheran School, and St. Matthew School.
Ownership History
Date
Name
Owned For
Owner Type
Purchase Details
Closed on
Dec 4, 2023
Sold by
Mcnew Capital Llc
Bought by
Pink Room Properties Llc
Current Estimated Value
Home Financials for this Owner
Home Financials are based on the most recent Mortgage that was taken out on this home.
Original Mortgage
$100,100
Outstanding Balance
$69,635
Interest Rate
8.25%
Mortgage Type
New Conventional
Estimated Equity
$125,240
Purchase Details
Closed on
Nov 22, 2019
Sold by
Illini Home Buyers Llc
Bought by
Mcnew Capital Llc
Purchase Details
Closed on
Nov 15, 2019
Sold by
Heller Eric
Bought by
Illini Home Buyers Llc
Purchase Details
Closed on
Aug 15, 2019
Sold by
Heller Eric and E Eloise Heller Trust
Bought by
Heller Eric
Purchase Details
Closed on
Apr 28, 2011
Sold by
Heller E Eloise
Bought by
Heller E Eloise
Create a Home Valuation Report for This Property
The Home Valuation Report is an in-depth analysis detailing your home's value as well as a comparison with similar homes in the area
Home Values in the Area
Average Home Value in this Area
Purchase History
| Date | Buyer | Sale Price | Title Company |
|---|---|---|---|
| Pink Room Properties Llc | $143,000 | None Listed On Document | |
| Mcnew Capital Llc | $110,000 | Attorney | |
| Illini Home Buyers Llc | $100,000 | Allied Capital Title | |
| Heller Eric | -- | Attorney | |
| Heller E Eloise | -- | None Available |
Source: Public Records
Mortgage History
| Date | Status | Borrower | Loan Amount |
|---|---|---|---|
| Open | Pink Room Properties Llc | $100,100 |
Source: Public Records
Tax History Compared to Growth
Tax History
| Year | Tax Paid | Tax Assessment Tax Assessment Total Assessment is a certain percentage of the fair market value that is determined by local assessors to be the total taxable value of land and additions on the property. | Land | Improvement |
|---|---|---|---|---|
| 2024 | $3,511 | $45,440 | $14,340 | $31,100 |
| 2022 | $3,511 | $38,180 | $12,050 | $26,130 |
| 2021 | $3,427 | $37,430 | $11,810 | $25,620 |
| 2020 | $3,432 | $37,430 | $11,810 | $25,620 |
| 2019 | $2,325 | $36,660 | $11,570 | $25,090 |
| 2018 | $2,543 | $50,190 | $11,390 | $38,800 |
| 2017 | $2,554 | $48,260 | $10,950 | $37,310 |
| 2016 | $2,338 | $47,260 | $10,720 | $36,540 |
| 2015 | $2,398 | $46,420 | $10,530 | $35,890 |
| 2014 | $2,377 | $46,420 | $10,530 | $35,890 |
| 2013 | $2,356 | $46,420 | $10,530 | $35,890 |
Source: Public Records
Map
Nearby Homes
- 1607 W William St
- 809 S Victor St
- 1608 Sheridan Rd
- 1709 W William St
- 605 S Fair St
- 1007 Holiday Dr
- 1303 S Western Ave
- 1208 W William St
- 1410 S Mattis Ave
- 1420 S Western Ave
- 1606 W Union St
- 1212 W Healey St
- 1211 W Springfield Ave
- 1612 W Kirby Ave
- 1407 W Clark St
- 1208 W Union St
- 302 Flora Dr
- 2003 W Kirby Ave
- 1302 W Clark St
- 2501 Sheridan Dr
- 1602 W Charles St
- 1516 W Charles St
- 1601 W William St
- 1604 W Charles St
- 1514 W Charles St
- 1603 W William St
- 816 S Fair St
- 1519 W Charles St
- 1605 W William St
- 1601 W Charles St
- 1515 W Charles St
- 1606 W Charles St
- 1603 W Charles St
- 814 S Fair St
- 1005 S Westlawn Ave
- 1003 S Westlawn Ave
- 1605 W Charles St
- 1605 W Charles St Unit 1
- 1007 S Westlawn Ave
- 1001 S Westlawn Ave