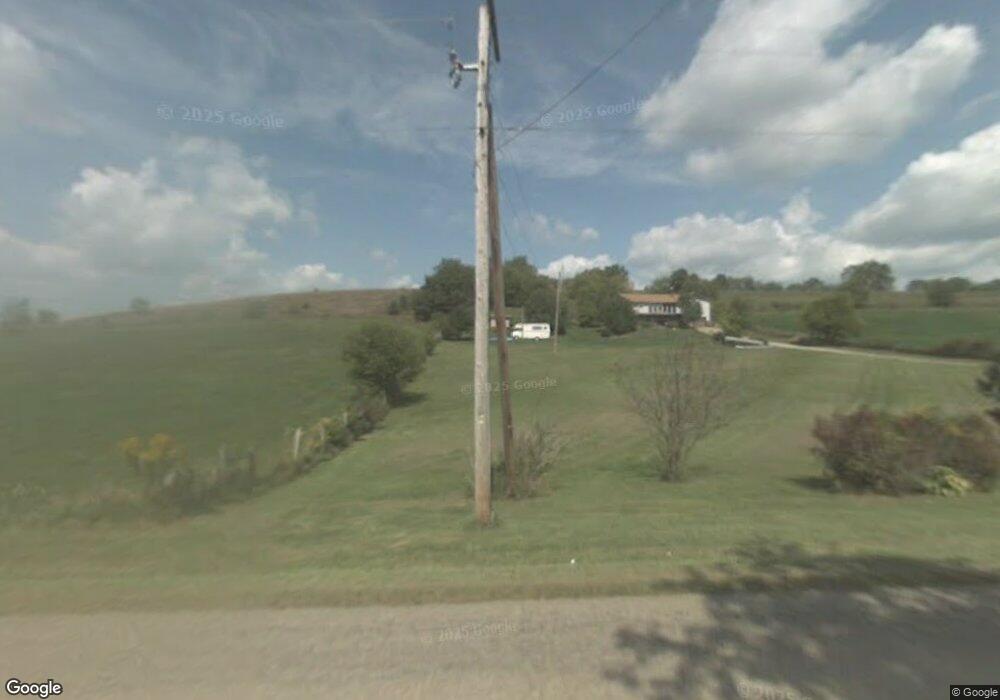
15185 Howard Danville Rd Danville, OH 43014
Estimated Value: $277,000 - $310,000
3
Beds
2
Baths
1,692
Sq Ft
$175/Sq Ft
Est. Value
About This Home
This home is located at 15185 Howard Danville Rd, Danville, OH 43014 and is currently estimated at $296,439, approximately $175 per square foot. 15185 Howard Danville Rd is a home located in Knox County with nearby schools including Danville Elementary School, Danville Middle School, and Danville High School.
Ownership History
Date
Name
Owned For
Owner Type
Purchase Details
Closed on
Jun 15, 2023
Sold by
Mast Milan W and Mast Susie E
Bought by
Yoder Roman D and Yoder Leanna L
Current Estimated Value
Home Financials for this Owner
Home Financials are based on the most recent Mortgage that was taken out on this home.
Original Mortgage
$180,000
Outstanding Balance
$175,187
Interest Rate
6.39%
Mortgage Type
New Conventional
Estimated Equity
$121,252
Purchase Details
Closed on
Jun 3, 2016
Sold by
Durbin Edward C
Bought by
Milan W Mast and Susie E Mast
Home Financials for this Owner
Home Financials are based on the most recent Mortgage that was taken out on this home.
Interest Rate
3.66%
Purchase Details
Closed on
Nov 9, 2000
Sold by
Durbin Edward C and Lynn Y
Bought by
Durbin Edward C
Create a Home Valuation Report for This Property
The Home Valuation Report is an in-depth analysis detailing your home's value as well as a comparison with similar homes in the area
Home Values in the Area
Average Home Value in this Area
Purchase History
| Date | Buyer | Sale Price | Title Company |
|---|---|---|---|
| Yoder Roman D | -- | None Listed On Document | |
| Milan W Mast | $69,000 | -- | |
| Durbin Edward C | -- | -- |
Source: Public Records
Mortgage History
| Date | Status | Borrower | Loan Amount |
|---|---|---|---|
| Open | Yoder Roman D | $180,000 | |
| Previous Owner | Milan W Mast | -- |
Source: Public Records
Tax History Compared to Growth
Tax History
| Year | Tax Paid | Tax Assessment Tax Assessment Total Assessment is a certain percentage of the fair market value that is determined by local assessors to be the total taxable value of land and additions on the property. | Land | Improvement |
|---|---|---|---|---|
| 2024 | $2,254 | $67,960 | $19,940 | $48,020 |
| 2023 | $2,254 | $67,960 | $19,940 | $48,020 |
| 2022 | $2,184 | $56,640 | $16,620 | $40,020 |
| 2021 | $2,184 | $56,640 | $16,620 | $40,020 |
| 2020 | $2,051 | $56,640 | $16,620 | $40,020 |
| 2019 | $1,710 | $44,410 | $10,120 | $34,290 |
| 2018 | $1,598 | $44,410 | $10,120 | $34,290 |
| 2017 | $1,559 | $41,280 | $10,120 | $31,160 |
| 2016 | $1,439 | $38,220 | $9,370 | $28,850 |
| 2015 | $1,430 | $38,220 | $9,370 | $28,850 |
| 2014 | $1,436 | $38,220 | $9,370 | $28,850 |
| 2013 | $1,474 | $37,320 | $8,450 | $28,870 |
Source: Public Records
Map
Nearby Homes
- 0 Howard-Danville Rd
- 13904 Carey Ln
- 106 W Rambo St
- 204 S Richards St
- 417 S Market St
- 228 E Walnut St
- 0 King Rd Unit 20250360
- 0 King Rd Unit 225019584
- 0 Westmoreland Dr Unit 225036591
- 0 Westmoreland Dr Unit 225024813
- 0 Westmoreland Dr Unit 20250682
- 43 S Highland Ct
- 143 Grand Ridge Rd
- 733 Grand View Dr
- 379 Highland Hills Dr
- 0 Grand Valley Dr Unit 5161854
- 419 Highland Hills Cir
- 701 Grand View Dr
- 431 Highland Hills Cir
- 0 Valleyridge Dr Unit Lot 346
- 15177 Howard Danville Rd
- 15148 Howard Danville Rd
- 15119 Howard Danville Rd
- 15116 Chapel Rd
- 14981 Carey Ln
- 15330 Howard Danville Rd
- 15350 Howard Danville Rd
- 14641 Humbert Rd
- 14945 Carey Ln
- 14945 Carey Ln
- 14922 Carey Ln
- 14940 Carey Ln
- 15736 Chapel Rd
- 15736 Chapel Rd
- 25860 Danville Amity Rd
- 26000 Danville Amity Rd
- 15384 Howard Danville Rd
- 25640 Danville Amity Rd
- 15420 Howard Danville Rd
- 26100 Danville Amity Rd