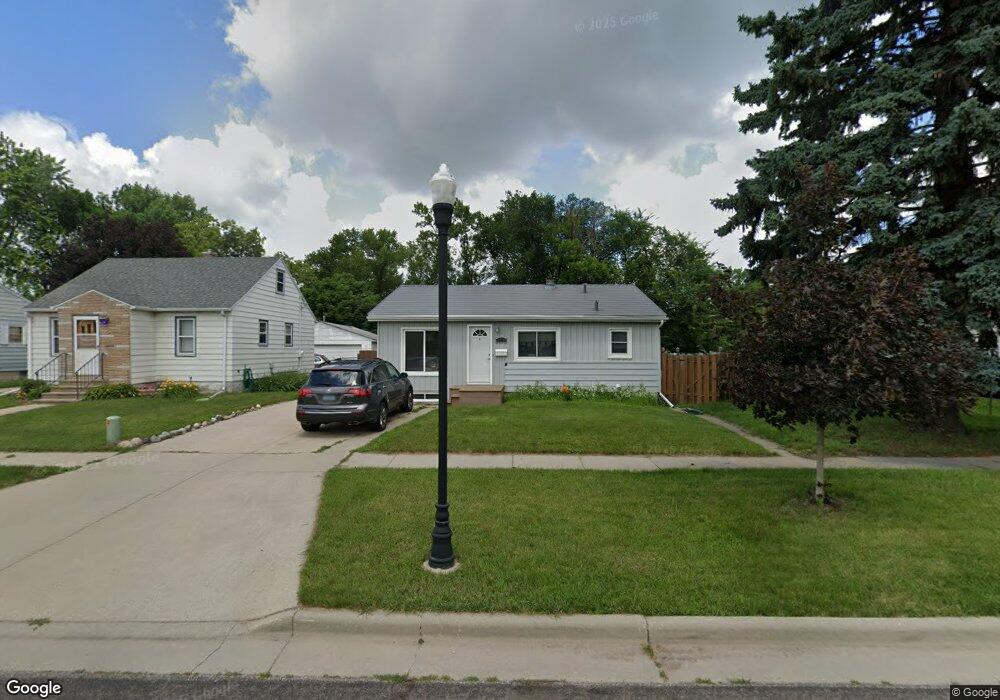
1519 11th Ave S Fargo, ND 58103
Jefferson-Carl NeighborhoodEstimated Value: $239,000 - $305,921
3
Beds
2
Baths
1,920
Sq Ft
$137/Sq Ft
Est. Value
About This Home
This home is located at 1519 11th Ave S, Fargo, ND 58103 and is currently estimated at $262,980, approximately $136 per square foot. 1519 11th Ave S is a home located in Cass County with nearby schools including Clara Barton Elementary School, Carl Ben Eielson Middle School, and South High School.
Ownership History
Date
Name
Owned For
Owner Type
Purchase Details
Closed on
Sep 1, 2017
Sold by
Olson Andrew J and Olson Samantha J
Bought by
Anderson Kenneth J and Anderson Sarah M
Current Estimated Value
Home Financials for this Owner
Home Financials are based on the most recent Mortgage that was taken out on this home.
Original Mortgage
$115,200
Outstanding Balance
$62,256
Interest Rate
3.96%
Mortgage Type
New Conventional
Estimated Equity
$200,724
Purchase Details
Closed on
Sep 8, 2014
Sold by
Jesser Alan J and Jesser Joanna K
Bought by
Olson Andrew J and Olson Samantha J
Home Financials for this Owner
Home Financials are based on the most recent Mortgage that was taken out on this home.
Original Mortgage
$157,985
Interest Rate
3.5%
Mortgage Type
FHA
Purchase Details
Closed on
Dec 14, 2007
Sold by
Nagel Richard P
Bought by
Jesser Alan J and Jesser Joanna K
Home Financials for this Owner
Home Financials are based on the most recent Mortgage that was taken out on this home.
Original Mortgage
$116,050
Interest Rate
5.8%
Mortgage Type
FHA
Create a Home Valuation Report for This Property
The Home Valuation Report is an in-depth analysis detailing your home's value as well as a comparison with similar homes in the area
Home Values in the Area
Average Home Value in this Area
Purchase History
| Date | Buyer | Sale Price | Title Company |
|---|---|---|---|
| Anderson Kenneth J | $192,000 | Title Co | |
| Olson Andrew J | -- | Title Co | |
| Jesser Alan J | -- | -- |
Source: Public Records
Mortgage History
| Date | Status | Borrower | Loan Amount |
|---|---|---|---|
| Open | Anderson Kenneth J | $115,200 | |
| Previous Owner | Olson Andrew J | $157,985 | |
| Previous Owner | Jesser Alan J | $116,050 |
Source: Public Records
Tax History Compared to Growth
Tax History
| Year | Tax Paid | Tax Assessment Tax Assessment Total Assessment is a certain percentage of the fair market value that is determined by local assessors to be the total taxable value of land and additions on the property. | Land | Improvement |
|---|---|---|---|---|
| 2024 | $3,360 | $140,650 | $31,850 | $108,800 |
| 2023 | $3,696 | $135,250 | $31,850 | $103,400 |
| 2022 | $3,626 | $130,050 | $31,850 | $98,200 |
| 2021 | $3,110 | $113,100 | $31,850 | $81,250 |
| 2020 | $3,070 | $113,100 | $31,850 | $81,250 |
| 2019 | $2,350 | $85,600 | $18,900 | $66,700 |
| 2018 | $2,320 | $85,600 | $18,900 | $66,700 |
| 2017 | $2,236 | $83,250 | $18,900 | $64,350 |
| 2016 | $2,427 | $80,950 | $18,900 | $62,050 |
| 2015 | $2,116 | $63,550 | $12,950 | $50,600 |
| 2014 | $2,157 | $63,550 | $12,950 | $50,600 |
| 2013 | $2,058 | $60,500 | $12,950 | $47,550 |
Source: Public Records
Map
Nearby Homes
- 1517 9th Ave S
- 1637 10th Ave S
- 1414 10th Ave S
- 1418 11th Ave S
- 1418 12th Ave S
- 1301 16 1 2 St S
- 813 17th St S
- 1709 13th Ave S
- 818 19th St S
- 814 19th St S
- 1314 14th St S
- 910 University Dr S
- 1112 University Dr S
- 1124 University Dr S
- 1208 University Dr S
- 1410 14 1 2 St S
- 1407 17th St S
- 1118 8th Ave S
- 2009 13th Ave S
- 2013 13th Ave S
- 1509 11th Ave S
- 1523 11th Ave S
- 1527 11th Ave S
- 1531 11th Ave S
- 1021 15th St S
- 1027 15th St S
- 1017 15th St S
- 1029 15th St S
- 1522 10th Ave S
- 1518 10th Ave S
- 1526 10th Ave S
- 1524 11th Ave S
- 1013 15th St S
- 1514 10th Ave S
- 1526 11th Ave S
- 1522 11th Ave S
- 1530 10th Ave S
- 1101 15th St S
- 1534 10th Ave S
- 1009 15th St S