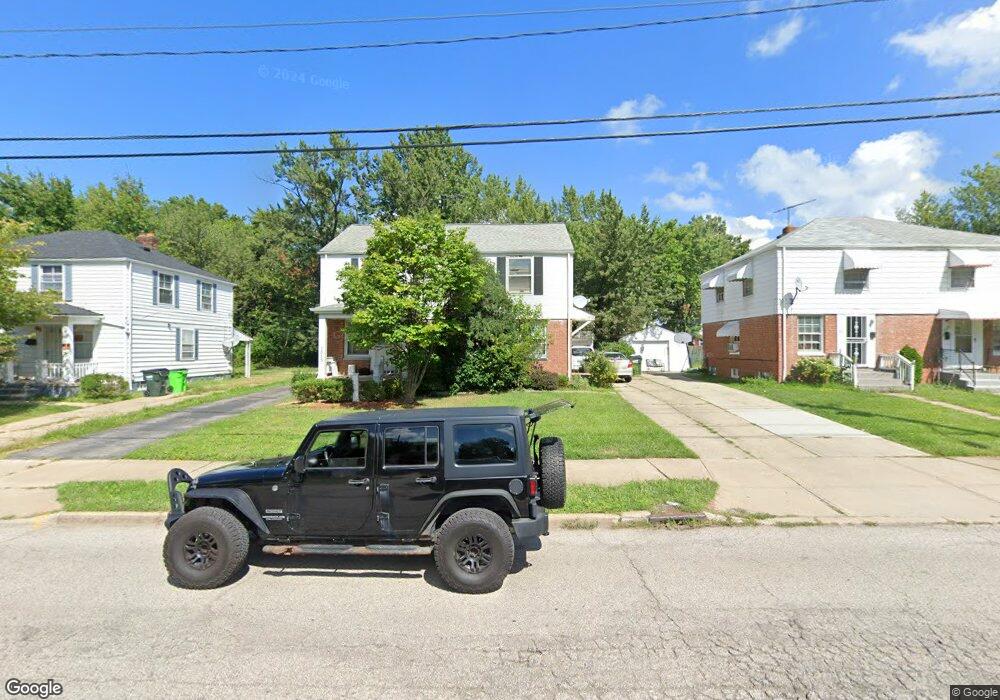
1519 Babbitt Rd Euclid, OH 44132
Estimated Value: $72,000 - $78,000
About This Home
This home is located at 1519 Babbitt Rd, Euclid, OH 44132 and is currently estimated at $74,334, approximately $86 per square foot. 1519 Babbitt Rd is a home located in Cuyahoga County with nearby schools including Bluestone Elementary School, Euclid High School, and Euclid Preparatory School.
Ownership History
We collect this data history from publicly available records. To have your information removed, we recommend requesting removal directly through your county’s website.
Purchase Details
Home Financials for this Owner
Home Financials are based on the most recent Mortgage that was taken out on this home.Purchase Details
Purchase Details
Purchase Details
Purchase Details
Purchase Details
Home Values in the Area
Average Home Value in this Area
Purchase History
We collect this data history from publicly available records. To have your information removed, we recommend requesting removal directly through your county’s website.
| Date | Buyer | Sale Price | Title Company |
|---|---|---|---|
| $53,000 | Renaissance | ||
| $53,000 | Renancissance | ||
| -- | -- | ||
| -- | -- | ||
| $38,500 | -- | ||
| -- | -- | ||
| -- | -- |
Mortgage History
We collect this data history from publicly available records. To have your information removed, we recommend requesting removal directly through your county’s website.
| Date | Status | Borrower | Loan Amount |
|---|---|---|---|
| Open | $53,000 |
Tax History
We collect this data history from publicly available records. To have your information removed, we recommend requesting removal directly through your county’s website.
| Year | Tax Paid | Tax Assessment Tax Assessment Total Assessment is a certain percentage of the fair market value that is determined by local assessors to be the total taxable value of land and additions on the property. | Land | Improvement |
|---|---|---|---|---|
| 2025 | $1,683 | $23,835 | $4,480 | $19,355 |
| 2024 | $1,734 | $23,835 | $4,480 | $19,355 |
| 2023 | $1,502 | $16,280 | $3,890 | $12,390 |
| 2022 | $1,470 | $16,280 | $3,890 | $12,390 |
| 2021 | $1,629 | $16,280 | $3,890 | $12,390 |
| 2020 | $1,378 | $12,320 | $2,940 | $9,380 |
| 2019 | $1,236 | $35,200 | $8,400 | $26,800 |
| 2018 | $1,235 | $12,320 | $2,940 | $9,380 |
| 2017 | $1,316 | $10,890 | $2,380 | $8,510 |
| 2016 | $1,319 | $10,890 | $2,380 | $8,510 |
| 2015 | $1,402 | $10,890 | $2,380 | $8,510 |
| 2014 | $1,402 | $12,810 | $2,800 | $10,010 |
Map
- 1437 E 252nd St
- 1552 E 254th St
- 25250 Treadwell Ave
- 1464 E 250th St Unit E
- 1490 E 250th St
- 1492 E 250th St
- 1490 - 1492 E 250th St
- 25161 Euclid Ave
- 1730 Braeburn Park Dr
- 1422 E 264th St
- 24691 Hawthorne Dr
- 127 Brush Rd
- 25641 Glenbrook Blvd
- 1785 Idlehurst Dr
- 1790 Skyline Dr
- 25550 Glenbrook Blvd
- 1866 Braeburn Park Dr
- 1830 Beverly Hills Dr
- 25540 Chatworth Dr
- 24420 Glenbrook Blvd
- 1531 Babbitt Rd
- 1535 Babbitt Rd
- 1539 Babbitt Rd
- 1515 Babbitt Rd
- 1539 & 1543 Babbitt Rd
- 1562 E 256th St
- 1564 E 256th St
- 1566 E 256th St
- 1560 E 256th St
- 1511 Babbitt Rd
- 1543 Babbitt Rd
- 1568 E 256th St
- 1558 E 256th St
- 1556 E 256th St
- 1570 E 256th St
- 1547 Babbitt Rd
- 1510 Babbitt Rd
- 1503 Babbitt Rd
- 1520 Babbitt Rd
- 1516 Babbitt Rd
Ask me questions while you tour the home.