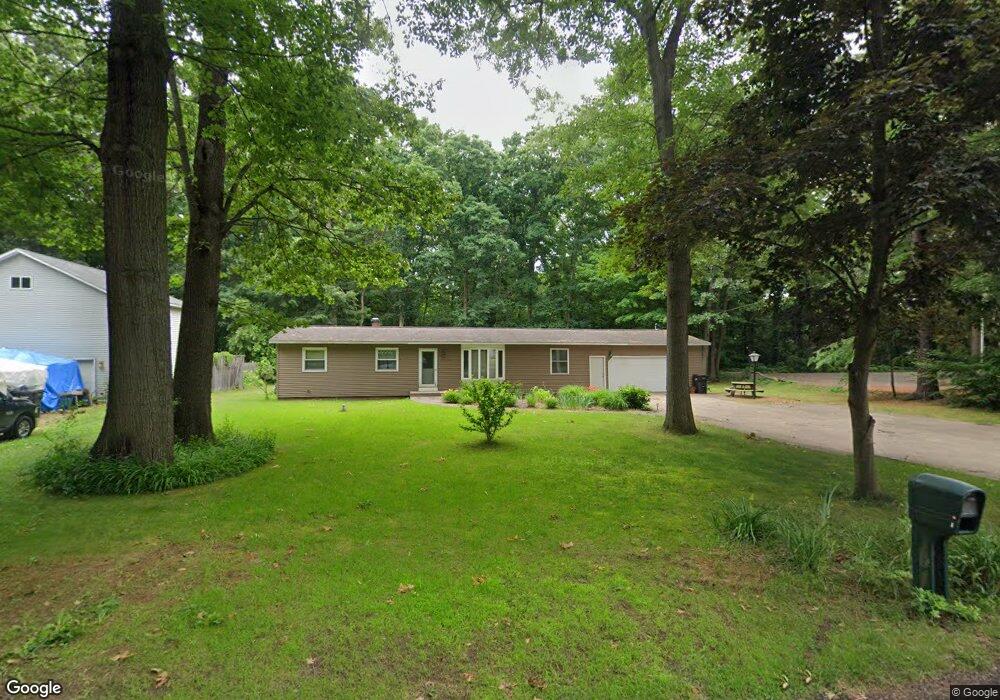
1519 Fern St Allegan, MI 49010
Estimated Value: $179,000 - $261,000
3
Beds
2
Baths
1,392
Sq Ft
$165/Sq Ft
Est. Value
About This Home
This home is located at 1519 Fern St, Allegan, MI 49010 and is currently estimated at $229,572, approximately $164 per square foot. 1519 Fern St is a home located in Allegan County with nearby schools including Dawson Elementary School, L.E. White Middle School, and Allegan High School.
Ownership History
Date
Name
Owned For
Owner Type
Purchase Details
Closed on
Oct 12, 2018
Sold by
Hopkins Angel F
Bought by
Clemens Joshua
Current Estimated Value
Home Financials for this Owner
Home Financials are based on the most recent Mortgage that was taken out on this home.
Original Mortgage
$88,369
Outstanding Balance
$77,260
Interest Rate
4.62%
Mortgage Type
FHA
Estimated Equity
$152,312
Purchase Details
Closed on
Aug 16, 2016
Sold by
Clemens Mary I
Bought by
Clemens Mary I and The Mary Inez Clemens Living Trust
Purchase Details
Closed on
May 9, 2001
Sold by
Clemens Mary I
Bought by
Clemens Mary I
Create a Home Valuation Report for This Property
The Home Valuation Report is an in-depth analysis detailing your home's value as well as a comparison with similar homes in the area
Home Values in the Area
Average Home Value in this Area
Purchase History
| Date | Buyer | Sale Price | Title Company |
|---|---|---|---|
| Clemens Joshua | $90,000 | Nations Title Agency | |
| Clemens Mary I | -- | Attorney | |
| Clemens Mary I | -- | -- |
Source: Public Records
Mortgage History
| Date | Status | Borrower | Loan Amount |
|---|---|---|---|
| Open | Clemens Joshua | $88,369 |
Source: Public Records
Tax History Compared to Growth
Tax History
| Year | Tax Paid | Tax Assessment Tax Assessment Total Assessment is a certain percentage of the fair market value that is determined by local assessors to be the total taxable value of land and additions on the property. | Land | Improvement |
|---|---|---|---|---|
| 2025 | $1,555 | $88,900 | $11,300 | $77,600 |
| 2024 | $1,416 | $86,200 | $10,600 | $75,600 |
| 2023 | $1,416 | $77,900 | $9,800 | $68,100 |
| 2022 | $1,416 | $66,300 | $11,100 | $55,200 |
| 2021 | $1,310 | $58,800 | $10,600 | $48,200 |
| 2020 | $1,310 | $58,700 | $9,800 | $48,900 |
| 2019 | $0 | $59,800 | $11,800 | $48,000 |
| 2018 | $0 | $56,000 | $12,000 | $44,000 |
| 2017 | $0 | $51,200 | $11,800 | $39,400 |
| 2016 | $0 | $40,300 | $7,100 | $33,200 |
| 2015 | -- | $40,300 | $7,100 | $33,200 |
| 2014 | -- | $38,500 | $7,900 | $30,600 |
| 2013 | -- | $43,400 | $7,900 | $35,500 |
Source: Public Records
Map
Nearby Homes