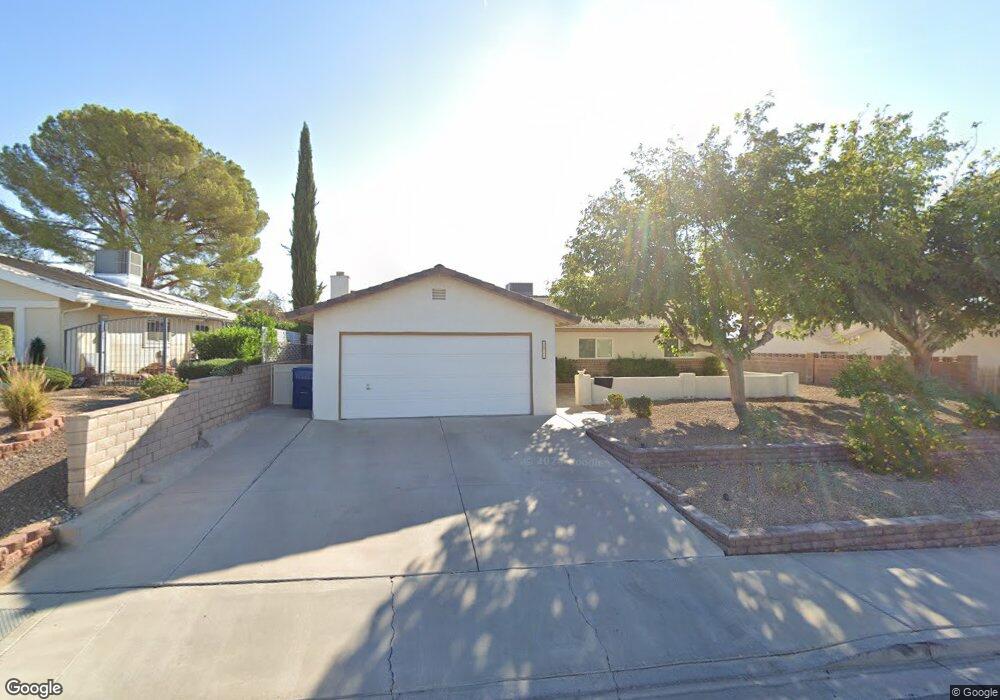
1519 Mancha Dr Boulder City, NV 89005
Estimated Value: $469,675 - $502,000
3
Beds
2
Baths
1,488
Sq Ft
$328/Sq Ft
Est. Value
About This Home
This home is located at 1519 Mancha Dr, Boulder City, NV 89005 and is currently estimated at $487,919, approximately $327 per square foot. 1519 Mancha Dr is a home located in Clark County with nearby schools including Andrew Mitchell Elementary School, Martha P. King Elementary School, and Elton M. & Madelaine E. Garrett Junior High School.
Ownership History
Date
Name
Owned For
Owner Type
Purchase Details
Closed on
Jul 23, 2018
Sold by
Rovacchi Cindy A
Bought by
Sampson Cindy A and Cindy A Sampson Trust
Current Estimated Value
Purchase Details
Closed on
Aug 4, 2008
Sold by
Rovacchi Cindy
Bought by
Rovacchi Cindy A and Cindy A Rovacchi Trust
Purchase Details
Closed on
Jul 13, 2001
Sold by
Rovacchi Cindy
Bought by
Rovacchi Cindy
Home Financials for this Owner
Home Financials are based on the most recent Mortgage that was taken out on this home.
Original Mortgage
$132,600
Interest Rate
7.15%
Purchase Details
Closed on
Jan 25, 2001
Sold by
Rovacchi Ronald W
Bought by
Rovacchi Cindy
Purchase Details
Closed on
Feb 16, 1994
Sold by
Tanksley Richard D and Tanksley Jane A
Bought by
Rovacchi Ron W and Rovacchi Cindy
Home Financials for this Owner
Home Financials are based on the most recent Mortgage that was taken out on this home.
Original Mortgage
$138,700
Interest Rate
7.59%
Create a Home Valuation Report for This Property
The Home Valuation Report is an in-depth analysis detailing your home's value as well as a comparison with similar homes in the area
Home Values in the Area
Average Home Value in this Area
Purchase History
| Date | Buyer | Sale Price | Title Company |
|---|---|---|---|
| Sampson Cindy A | -- | None Available | |
| Rovacchi Cindy A | -- | None Available | |
| Rovacchi Cindy | -- | United Title | |
| Rovacchi Cindy | -- | -- | |
| Rovacchi Ron W | $146,000 | United Title |
Source: Public Records
Mortgage History
| Date | Status | Borrower | Loan Amount |
|---|---|---|---|
| Previous Owner | Rovacchi Cindy | $132,600 | |
| Previous Owner | Rovacchi Ron W | $138,700 |
Source: Public Records
Tax History Compared to Growth
Tax History
| Year | Tax Paid | Tax Assessment Tax Assessment Total Assessment is a certain percentage of the fair market value that is determined by local assessors to be the total taxable value of land and additions on the property. | Land | Improvement |
|---|---|---|---|---|
| 2025 | $1,452 | $84,849 | $58,100 | $26,749 |
| 2024 | $1,409 | $84,849 | $58,100 | $26,749 |
| 2023 | $1,409 | $70,572 | $43,750 | $26,822 |
| 2022 | $1,368 | $63,424 | $38,150 | $25,274 |
| 2021 | $1,329 | $60,997 | $36,400 | $24,597 |
| 2020 | $1,290 | $60,317 | $35,350 | $24,967 |
| 2019 | $1,252 | $54,944 | $29,750 | $25,194 |
| 2018 | $1,216 | $54,524 | $29,750 | $24,774 |
| 2017 | $1,447 | $55,395 | $29,750 | $25,645 |
| 2016 | $1,150 | $50,992 | $24,500 | $26,492 |
| 2015 | $1,148 | $44,120 | $17,500 | $26,620 |
| 2014 | $1,115 | $41,779 | $15,750 | $26,029 |
Source: Public Records
Map
Nearby Homes
- 1511 Irene Dr
- 1527 Irene Dr
- 976 El Camino Way
- 1000 Legacy Dr
- 893 Fairway Dr
- 1010 Legacy Dr
- 782 Sandra Dr
- 798 Fairway Dr
- 1437 Cattail Falls St
- 1505 Carlsbad St
- 776 San Remo Way
- 1321 Nadine Way
- 1414 Cattail Falls St
- 1546 Georgia Ave
- 873 Montera Ln
- 839 Benita Place
- 834 Benita Place
- 1316 Capri Dr Unit A,B,C,&D
- 1564 Sandra Dr Unit 6
- 855 Del Rey Dr