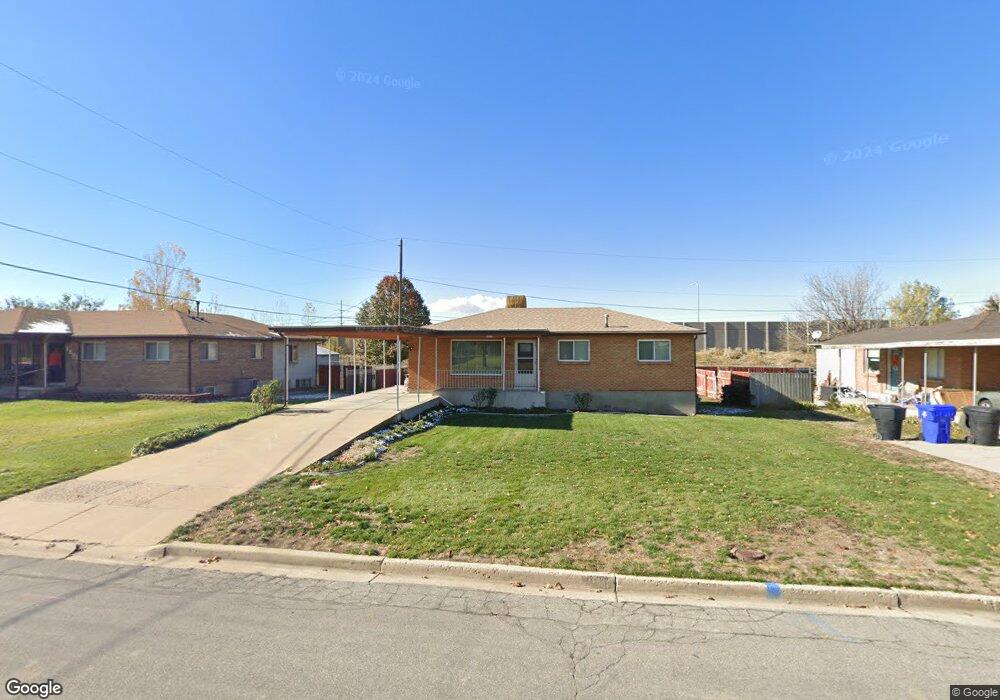
1519 N 400 W Bountiful, UT 84010
Estimated Value: $421,000 - $469,000
4
Beds
2
Baths
1,050
Sq Ft
$431/Sq Ft
Est. Value
About This Home
This home is located at 1519 N 400 W, Bountiful, UT 84010 and is currently estimated at $452,217, approximately $430 per square foot. 1519 N 400 W is a home located in Davis County with nearby schools including Meadowbrook Elementary School, Bountiful Junior High School, and Viewmont High School.
Ownership History
Date
Name
Owned For
Owner Type
Purchase Details
Closed on
Feb 14, 2017
Sold by
Christensen Reed J
Bought by
Christensen Reed J and Christensen Living Trust
Current Estimated Value
Purchase Details
Closed on
Sep 16, 2003
Sold by
Christensen G Blake
Bought by
Christensen Reed J
Purchase Details
Closed on
Aug 29, 2001
Sold by
Christensen Isabel M
Bought by
Christensen Andrew C and Christensen Kenneth I
Create a Home Valuation Report for This Property
The Home Valuation Report is an in-depth analysis detailing your home's value as well as a comparison with similar homes in the area
Home Values in the Area
Average Home Value in this Area
Purchase History
| Date | Buyer | Sale Price | Title Company |
|---|---|---|---|
| Christensen Reed J | -- | -- | |
| Christensen Reed J | -- | -- | |
| Christensen Reed J | -- | -- | |
| Christensen Reed J | -- | -- | |
| Christensen Reed J | -- | -- | |
| Christensen Reed J | -- | -- | |
| Christensen Andrew C | -- | -- |
Source: Public Records
Tax History Compared to Growth
Tax History
| Year | Tax Paid | Tax Assessment Tax Assessment Total Assessment is a certain percentage of the fair market value that is determined by local assessors to be the total taxable value of land and additions on the property. | Land | Improvement |
|---|---|---|---|---|
| 2025 | $2,457 | $216,150 | $138,507 | $77,643 |
| 2024 | $2,267 | $207,901 | $125,659 | $82,242 |
| 2023 | $2,223 | $371,000 | $229,443 | $141,557 |
| 2022 | $2,308 | $211,751 | $124,823 | $86,928 |
| 2021 | $2,147 | $302,000 | $163,433 | $138,567 |
| 2020 | $1,763 | $246,000 | $138,860 | $107,140 |
| 2019 | $1,888 | $259,000 | $141,657 | $117,343 |
| 2018 | $1,632 | $218,000 | $138,746 | $79,254 |
| 2016 | $1,491 | $108,460 | $59,029 | $49,431 |
| 2015 | $1,459 | $100,100 | $59,029 | $41,071 |
| 2014 | $1,401 | $98,869 | $59,029 | $39,840 |
| 2013 | -- | $94,648 | $36,190 | $58,458 |
Source: Public Records
Map
Nearby Homes
- Hampton Traditional Plan at Belmont Farms
- 1503 N 300 W
- 1520 N 550 W
- 235 W 1400 N
- 1410 N 200 W
- 239 Lyman Ln
- 215 Lyman Ln
- 234 Leah Cir
- 204 Lyman Ln
- 1260 N 200 W
- 1194 N 200 W
- 366 W 1000 N
- 420 Rawlins Cir
- 96 Village Square Rd
- 184 Park Shadows Cir
- 790 N 500 W
- 580 W 2125 N
- 29 W Lady Ln
- 810 Park Shadows Cir
- 353 Florentine Ln