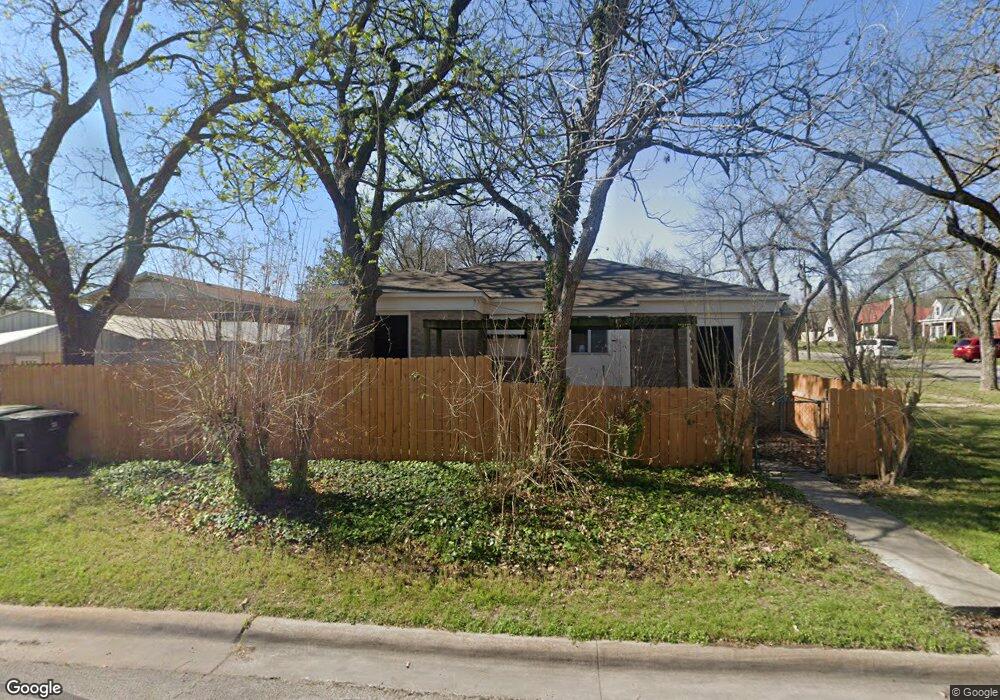
1519 N 5th St Temple, TX 76501
Garden DIstrict NeighborhoodEstimated Value: $141,230 - $154,000
3
Beds
1
Bath
990
Sq Ft
$150/Sq Ft
Est. Value
About This Home
This home is located at 1519 N 5th St, Temple, TX 76501 and is currently estimated at $148,808, approximately $150 per square foot. 1519 N 5th St is a home located in Bell County with nearby schools including Jefferson Elementary School, Lamar Middle, and Temple High School.
Ownership History
Date
Name
Owned For
Owner Type
Purchase Details
Closed on
Nov 2, 2018
Sold by
Rush Kevin
Bought by
Currington Lisa Christina
Current Estimated Value
Purchase Details
Closed on
Jun 13, 2014
Sold by
Ramdohr Ragnar and Ponce Quintero Anays D
Bought by
Rush Kevin
Home Financials for this Owner
Home Financials are based on the most recent Mortgage that was taken out on this home.
Original Mortgage
$18,000
Interest Rate
4.35%
Mortgage Type
Purchase Money Mortgage
Create a Home Valuation Report for This Property
The Home Valuation Report is an in-depth analysis detailing your home's value as well as a comparison with similar homes in the area
Home Values in the Area
Average Home Value in this Area
Purchase History
| Date | Buyer | Sale Price | Title Company |
|---|---|---|---|
| Currington Lisa Christina | -- | None Available | |
| Rush Kevin | -- | None Available |
Source: Public Records
Mortgage History
| Date | Status | Borrower | Loan Amount |
|---|---|---|---|
| Previous Owner | Rush Kevin | $18,000 |
Source: Public Records
Tax History Compared to Growth
Tax History
| Year | Tax Paid | Tax Assessment Tax Assessment Total Assessment is a certain percentage of the fair market value that is determined by local assessors to be the total taxable value of land and additions on the property. | Land | Improvement |
|---|---|---|---|---|
| 2025 | $841 | $92,877 | -- | -- |
| 2024 | $841 | $84,434 | -- | -- |
| 2023 | $1,760 | $76,758 | $0 | $0 |
| 2022 | $1,671 | $69,780 | $0 | $0 |
| 2021 | $1,628 | $70,755 | $10,000 | $60,755 |
| 2020 | $1,547 | $57,669 | $10,000 | $47,669 |
| 2019 | $1,487 | $54,424 | $4,000 | $50,424 |
| 2018 | $1,499 | $54,371 | $4,000 | $50,371 |
| 2017 | $1,486 | $54,287 | $4,000 | $50,287 |
| 2016 | $1,414 | $51,633 | $4,000 | $47,633 |
| 2014 | $1,039 | $50,279 | $0 | $0 |
Source: Public Records
Map
Nearby Homes