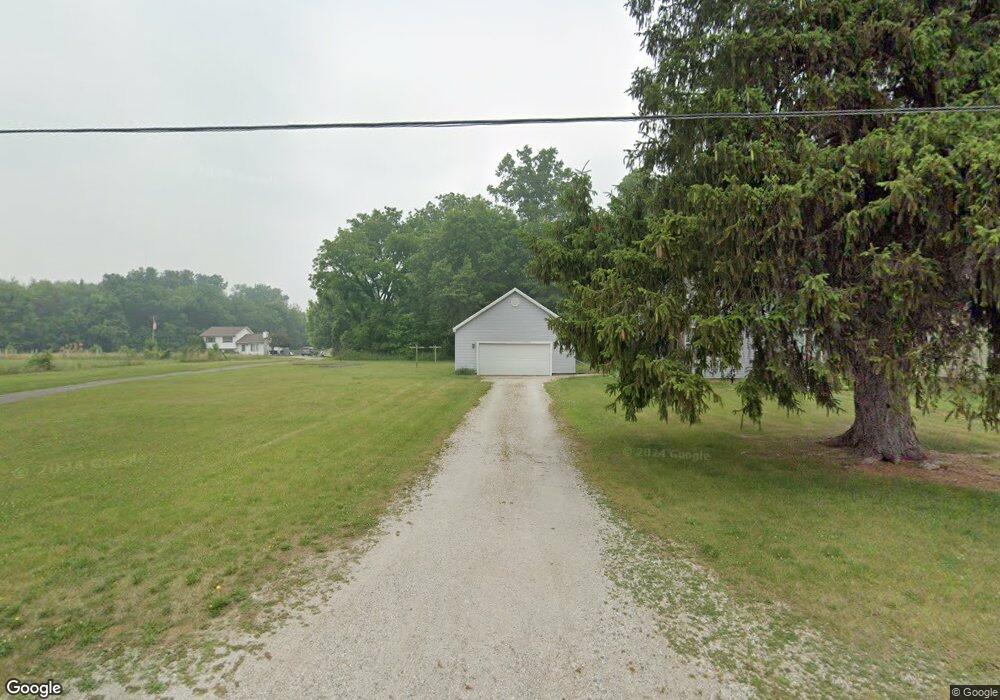
1519 S 875 E Mill Creek, IN 46365
Estimated Value: $146,307 - $208,000
2
Beds
2
Baths
1,048
Sq Ft
$165/Sq Ft
Est. Value
About This Home
This home is located at 1519 S 875 E, Mill Creek, IN 46365 and is currently estimated at $173,077, approximately $165 per square foot. 1519 S 875 E is a home located in LaPorte County with nearby schools including Indian Trail Elementary School, La Porte High School, and Kesling Intermediate School.
Ownership History
Date
Name
Owned For
Owner Type
Purchase Details
Closed on
Nov 1, 2011
Sold by
Henry Cynthia L and Henry Evan L
Bought by
Proud Matthew A
Current Estimated Value
Home Financials for this Owner
Home Financials are based on the most recent Mortgage that was taken out on this home.
Original Mortgage
$69,387
Outstanding Balance
$46,793
Interest Rate
4.02%
Mortgage Type
New Conventional
Estimated Equity
$126,284
Purchase Details
Closed on
Feb 14, 2008
Sold by
Federal National Mortgage Association
Bought by
Henry Cynthia L and Henry Evan L
Purchase Details
Closed on
Aug 21, 2007
Sold by
Richie Delmos and Richie Lisa
Bought by
Gmac Mortgage Llc
Purchase Details
Closed on
Aug 17, 2007
Sold by
Gmac Mortgage Llc
Bought by
Federal National Mortgage Association
Create a Home Valuation Report for This Property
The Home Valuation Report is an in-depth analysis detailing your home's value as well as a comparison with similar homes in the area
Purchase History
| Date | Buyer | Sale Price | Title Company |
|---|---|---|---|
| Proud Matthew A | -- | Metro | |
| Henry Cynthia L | -- | Meridian Title Corp | |
| Gmac Mortgage Llc | $94,553 | None Available | |
| Federal National Mortgage Association | -- | None Available |
Source: Public Records
Mortgage History
| Date | Status | Borrower | Loan Amount |
|---|---|---|---|
| Open | Proud Matthew A | $69,387 |
Source: Public Records
Tax History
| Year | Tax Paid | Tax Assessment Tax Assessment Total Assessment is a certain percentage of the fair market value that is determined by local assessors to be the total taxable value of land and additions on the property. | Land | Improvement |
|---|---|---|---|---|
| 2025 | $634 | $85,600 | $13,500 | $72,100 |
| 2024 | $565 | $82,700 | $13,500 | $69,200 |
| 2023 | $382 | $78,900 | $13,500 | $65,400 |
| 2022 | $422 | $80,900 | $13,500 | $67,400 |
| 2021 | $347 | $75,400 | $13,500 | $61,900 |
| 2020 | $343 | $75,400 | $13,500 | $61,900 |
| 2019 | $492 | $75,500 | $13,500 | $62,000 |
| 2018 | $730 | $93,700 | $17,900 | $75,800 |
| 2017 | $631 | $87,100 | $17,900 | $69,200 |
| 2016 | $641 | $89,800 | $17,900 | $71,900 |
| 2014 | $412 | $84,000 | $17,900 | $66,100 |
Source: Public Records
Map
Nearby Homes
- 1606 N Longshore Dr
- 212 Lakeside Dr
- 9301 E Division Rd
- 325 Lilac Dr
- 2282 S Taylor Rd
- 0 S Longshore Dr
- 315 Holly Dr
- 6152 E State Road 4
- Vacant Land E 525 S
- 3961 State Road 104
- 3466 S State Road 104
- 260 E Hupp Rd
- 30430 Osborne Rd
- 30750 Inwood Rd
- 4191 E 400 S
- 30390 Inwood Rd
- 58521 Strawberry Rd
- 67 Acres E 300 N
- 8416 E 400 N
- 803 Red Robin Dr Unit 45
Your Personal Tour Guide
Ask me questions while you tour the home.