Estimated Value: $113,592 - $167,000
Studio
2
Baths
1,400
Sq Ft
$100/Sq Ft
Est. Value
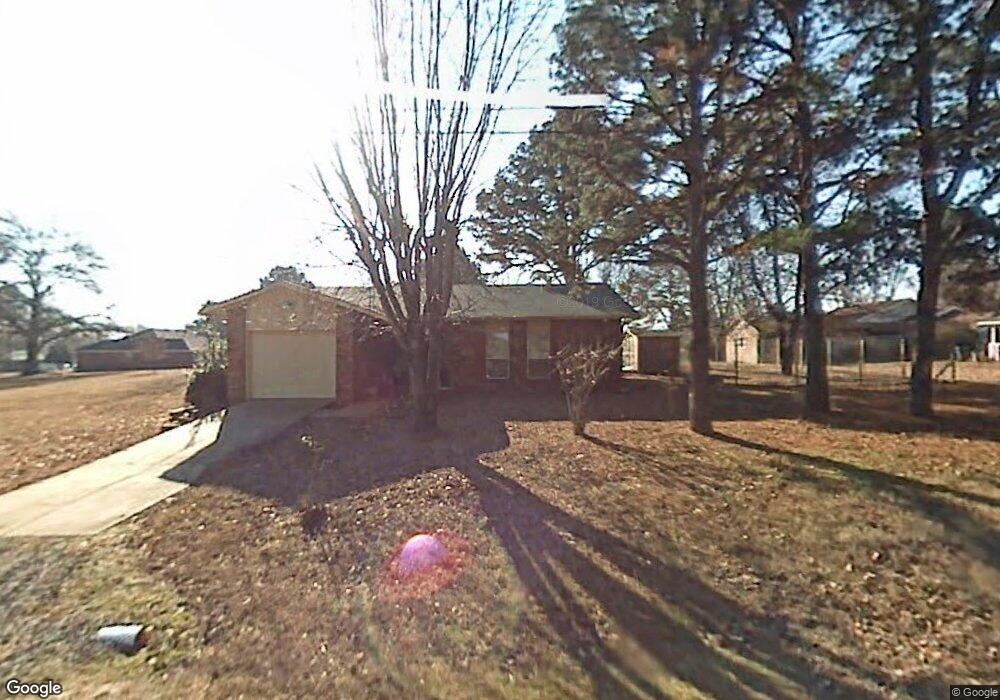
About This Home
This home is located at 1519 Vernon St, Ozark, AR 72949 and is currently estimated at $139,898, approximately $99 per square foot. 1519 Vernon St is a home located in Franklin County with nearby schools including Elgin B Milton Primary School, Ozark Kindergarten School, and Ozark Upper Elementary School.
Ownership History
Date
Name
Owned For
Owner Type
Purchase Details
Closed on
Aug 15, 2013
Sold by
Hillbilly Realty Inc
Bought by
Flanary Ashley
Current Estimated Value
Home Financials for this Owner
Home Financials are based on the most recent Mortgage that was taken out on this home.
Original Mortgage
$95,740
Outstanding Balance
$71,066
Interest Rate
4.42%
Mortgage Type
Unknown
Estimated Equity
$68,832
Purchase Details
Closed on
Mar 22, 2013
Sold by
Alexander Karen T
Bought by
Priority Bank
Purchase Details
Closed on
Aug 5, 2006
Sold by
O'Toole Cynthia Louis Abrigo
Bought by
Reading G and Reading Kent
Purchase Details
Closed on
Jul 1, 2004
Bought by
Jones and Jones
Purchase Details
Closed on
Feb 25, 2002
Bought by
Yount and Yount Jones
Purchase Details
Closed on
Nov 1, 1992
Bought by
Yount Heirs and Yount Yount
Purchase Details
Closed on
Jun 13, 1984
Bought by
Self and Morse
Create a Home Valuation Report for This Property
The Home Valuation Report is an in-depth analysis detailing your home's value as well as a comparison with similar homes in the area
Home Values in the Area
Average Home Value in this Area
Purchase History
| Date | Buyer | Sale Price | Title Company |
|---|---|---|---|
| Flanary Ashley | $90,000 | -- | |
| Priority Bank | $52,000 | -- | |
| Reading G | -- | -- | |
| Jones | -- | -- | |
| Yount | $53,000 | -- | |
| Yount Heirs | -- | -- | |
| Self | $43,800 | -- |
Source: Public Records
Mortgage History
| Date | Status | Borrower | Loan Amount |
|---|---|---|---|
| Open | Flanary Ashley | $95,740 |
Source: Public Records
Tax History
| Year | Tax Paid | Tax Assessment Tax Assessment Total Assessment is a certain percentage of the fair market value that is determined by local assessors to be the total taxable value of land and additions on the property. | Land | Improvement |
|---|---|---|---|---|
| 2025 | $152 | $13,960 | $1,250 | $12,710 |
| 2024 | $252 | $13,960 | $1,250 | $12,710 |
| 2023 | $328 | $13,960 | $1,250 | $12,710 |
| 2022 | $377 | $13,960 | $1,250 | $12,710 |
| 2021 | $344 | $13,960 | $1,250 | $12,710 |
| 2020 | $311 | $12,710 | $1,000 | $11,710 |
| 2019 | $310 | $12,710 | $1,000 | $11,710 |
| 2018 | $335 | $12,710 | $1,000 | $11,710 |
| 2017 | $335 | $12,710 | $1,000 | $11,710 |
| 2016 | $316 | $12,359 | $1,000 | $11,359 |
| 2015 | $284 | $11,770 | $2,000 | $9,770 |
| 2014 | -- | $11,770 | $2,000 | $9,770 |
| 2013 | -- | $11,770 | $2,000 | $9,770 |
Source: Public Records
Map
Nearby Homes
- TBD Arkansas 23
- 000 Arkansas 23
- 705 N 18th St
- 1703 Walden Dr
- 1208 Helberg Ln
- 4.11 Baldor Dr
- 5.81 Acres Baldor Dr
- 1912 Johnson St
- 1205 N 18th St
- 809 Owens St
- 1.4 Acres U S Highway 64
- 409 N 9th St
- 2006 Gordon Dr
- 809 W Gibson St
- 1008 W College St
- 312 Alston St
- 803 W School St
- 309 N 25th St
- 19940 Arkansas 23
- Tract 2 Arkansas 23
Your Personal Tour Guide
Ask me questions while you tour the home.