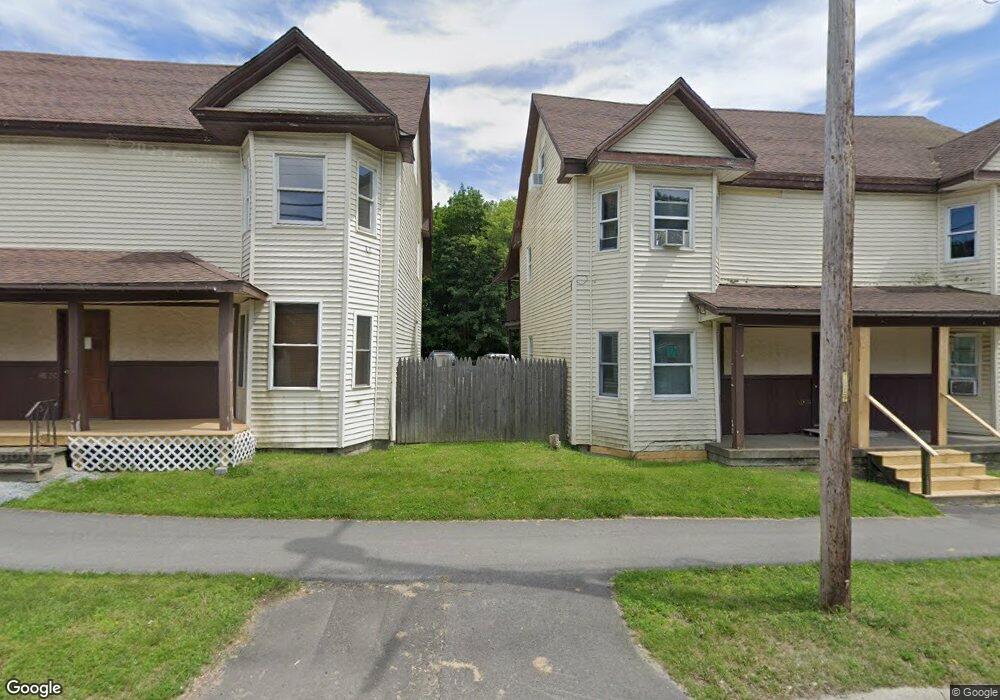
152 3rd St Bangor, ME 04401
West Bangor NeighborhoodEstimated Value: $306,000 - $849,000
Studio
--
Bath
4,176
Sq Ft
$143/Sq Ft
Est. Value
About This Home
This home is located at 152 3rd St, Bangor, ME 04401 and is currently estimated at $599,178, approximately $143 per square foot. 152 3rd St is a home with nearby schools including Vine Street School, Fairmount School, and James F. Doughty School.
Ownership History
Date
Name
Owned For
Owner Type
Purchase Details
Closed on
Jun 9, 2021
Sold by
Skyvillas Llc
Bought by
35 Main Downtown Llc
Current Estimated Value
Home Financials for this Owner
Home Financials are based on the most recent Mortgage that was taken out on this home.
Original Mortgage
$360,000
Outstanding Balance
$325,935
Interest Rate
2.9%
Mortgage Type
Purchase Money Mortgage
Estimated Equity
$273,243
Create a Home Valuation Report for This Property
The Home Valuation Report is an in-depth analysis detailing your home's value as well as a comparison with similar homes in the area
Home Values in the Area
Average Home Value in this Area
Purchase History
| Date | Buyer | Sale Price | Title Company |
|---|---|---|---|
| 35 Main Downtown Llc | -- | None Available | |
| 35 Main Downtown Llc | -- | None Available |
Source: Public Records
Mortgage History
| Date | Status | Borrower | Loan Amount |
|---|---|---|---|
| Open | 35 Main Downtown Llc | $360,000 | |
| Closed | 35 Main Downtown Llc | $360,000 |
Source: Public Records
Tax History
| Year | Tax Paid | Tax Assessment Tax Assessment Total Assessment is a certain percentage of the fair market value that is determined by local assessors to be the total taxable value of land and additions on the property. | Land | Improvement |
|---|---|---|---|---|
| 2024 | $5,700 | $307,300 | $11,600 | $295,700 |
| 2023 | $5,412 | $282,600 | $11,600 | $271,000 |
| 2022 | $5,071 | $248,600 | $11,600 | $237,000 |
| 2021 | $5,058 | $226,800 | $10,800 | $216,000 |
| 2020 | $4,925 | $212,300 | $10,200 | $202,100 |
| 2019 | $4,821 | $209,600 | $10,200 | $199,400 |
| 2018 | $4,565 | $198,900 | $10,000 | $188,900 |
| 2017 | $4,203 | $184,700 | $9,100 | $175,600 |
| 2016 | $4,241 | $188,500 | $9,100 | $179,400 |
| 2015 | $4,037 | $183,900 | $9,100 | $174,800 |
| 2014 | $3,944 | $180,900 | $9,100 | $171,800 |
| 2013 | $3,763 | $180,900 | $8,800 | $172,100 |
Source: Public Records
Map
Nearby Homes
- 152-154 3rd St Unit 7
- 152-154 3rd St Unit 8
- 148 -152 Third
- 148-152 Third St
- 148, 152 Third St
- 148-150 3rd St Unit 4
- 148-150 3rd St
- 148-150 3rd St Unit 5
- 148 3rd St
- 147 3rd St
- 151 3rd St
- 144 3rd St
- 78 Parker St
- 140 3rd St
- 121 Patten St
- 143 3rd St
- 163 3rd St
- 74 Parker St
- 163 -165 Third
- 0 163-165 Third
Your Personal Tour Guide
Ask me questions while you tour the home.