Estimated Value: $301,000 - $324,000
3
Beds
2
Baths
1,567
Sq Ft
$197/Sq Ft
Est. Value
About This Home
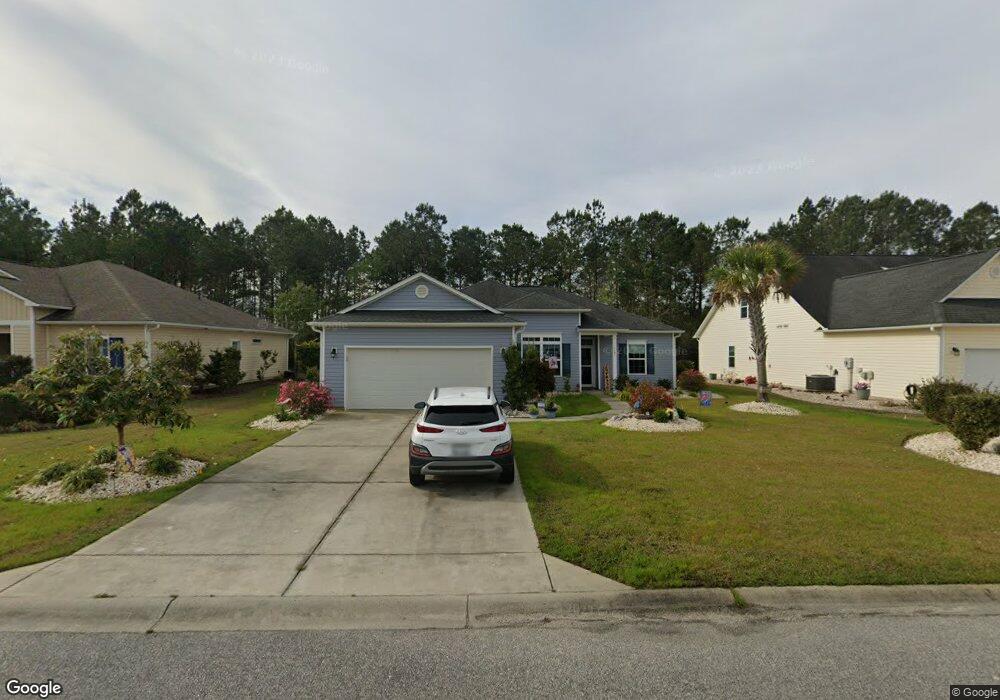
This home is located at 152 Belclare Way, Longs, SC 29568 and is currently estimated at $308,616, approximately $196 per square foot. 152 Belclare Way is a home located in Horry County with nearby schools including Daisy Elementary School, Loris Middle School, and Loris High School.
Ownership History
Date
Name
Owned For
Owner Type
Purchase Details
Closed on
Sep 8, 2015
Sold by
Moran Mark G and Moran Janice M
Bought by
Mark G Moran & Janice M Moran Revocable
Current Estimated Value
Purchase Details
Closed on
Apr 2, 2015
Sold by
Rs Parker Homes Llc
Bought by
Moran Mark G and Moran Janice M
Home Financials for this Owner
Home Financials are based on the most recent Mortgage that was taken out on this home.
Original Mortgage
$138,330
Outstanding Balance
$106,875
Interest Rate
3.84%
Mortgage Type
Future Advance Clause Open End Mortgage
Estimated Equity
$201,741
Purchase Details
Closed on
Jan 13, 2015
Sold by
Gladstone Development Llc
Bought by
Rs Parker Homes Llc
Home Financials for this Owner
Home Financials are based on the most recent Mortgage that was taken out on this home.
Original Mortgage
$121,500
Interest Rate
3.88%
Mortgage Type
Purchase Money Mortgage
Create a Home Valuation Report for This Property
The Home Valuation Report is an in-depth analysis detailing your home's value as well as a comparison with similar homes in the area
Home Values in the Area
Average Home Value in this Area
Purchase History
| Date | Buyer | Sale Price | Title Company |
|---|---|---|---|
| Mark G Moran & Janice M Moran Revocable | -- | -- | |
| Moran Mark G | $172,920 | -- | |
| Rs Parker Homes Llc | $15,000 | -- |
Source: Public Records
Mortgage History
| Date | Status | Borrower | Loan Amount |
|---|---|---|---|
| Open | Moran Mark G | $138,330 | |
| Previous Owner | Rs Parker Homes Llc | $121,500 |
Source: Public Records
Tax History Compared to Growth
Tax History
| Year | Tax Paid | Tax Assessment Tax Assessment Total Assessment is a certain percentage of the fair market value that is determined by local assessors to be the total taxable value of land and additions on the property. | Land | Improvement |
|---|---|---|---|---|
| 2024 | $662 | $12,154 | $3,074 | $9,080 |
| 2023 | $662 | $6,977 | $916 | $6,061 |
| 2021 | $561 | $7,960 | $936 | $7,024 |
| 2020 | $478 | $7,960 | $936 | $7,024 |
| 2019 | $478 | $7,960 | $936 | $7,024 |
| 2018 | $409 | $6,067 | $1,223 | $4,844 |
| 2017 | $394 | $6,067 | $1,223 | $4,844 |
| 2016 | -- | $13,939 | $1,223 | $12,716 |
| 2015 | $115 | $3,211 | $3,211 | $0 |
| 2014 | $384 | $1,835 | $1,835 | $0 |
Source: Public Records
Map
Nearby Homes
- 210 Belclare Way
- 200 Belclare Way
- 321 Galway Ct
- 116 Belclare Way
- 345 Galway Ct
- 409 Carrick Loop
- 556 Carrick Loop
- 985 Oak Hollow St Unit Lot 76, Monaco II C2
- 423 White Willow Way Unit Lot 128-Barnard C6
- 977 Oak Hollow St Unit Lot 74-Oliver B
- 990 Oak Hollow St Unit Lot 94-Benton II B
- 986 Oak Hollow St Unit Lot 95 - Gardener C
- 144 Crabapple Dr
- 912 Birch Garden Dr Unit Lot 132
- 131 Crabapple Dr
- 891 Birch Garden Dr Unit Lot 127 Gardener II
- 887 Birch Garden Dr Unit Lot 126 Wisteria II
- 883 Birch Garden Dr Unit Lot 125-Blossom
- 966 Oak Hollow St Unit Lot 98-Courtney II B
- 900 Birch Garden Dr Unit Lot 135 - Barnard D
- 152 Belclare Way Unit Lot 86
- 156 Belclare Way
- 156 Belclare Way Unit Lot 85
- 148 Belclare Way
- 148 Belclare Way Unit Arbor Glen
- 148 Belclare Way Unit Lot 87
- 160 Belclare Way
- 160 Belclare Way Unit Lot 84
- 144 Belclare Way
- 240 Belclare Way
- 240 Belclare Way Unit Lot 74
- 232 Belclare Way
- 232 Belclare Way Unit Lot 75
- 155 Belclare Way
- 155 Belclare Way Unit Lot 27
- 149 Belclare Way
- 149 Belclare Way Unit Lot 26
- 168 Belclare Way
- 168 Belclare Way Unit Lot 83
- 140 Belclare Way