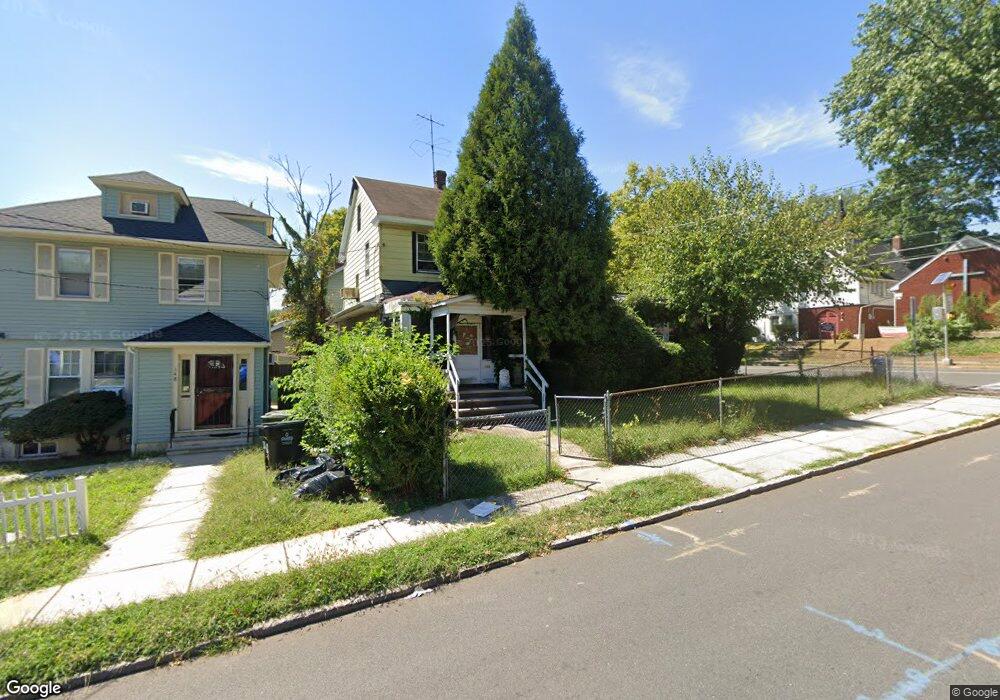
152 Clark St Hillside, NJ 07205
Estimated Value: $385,451 - $607,000
--
Bed
--
Bath
3,097
Sq Ft
$165/Sq Ft
Est. Value
About This Home
This home is located at 152 Clark St, Hillside, NJ 07205 and is currently estimated at $512,363, approximately $165 per square foot. 152 Clark St is a home located in Union County with nearby schools including Abram P. Morris-Saybrook Elementary School, Ola Edwards Community School, and Hurden Looker School.
Ownership History
Date
Name
Owned For
Owner Type
Purchase Details
Closed on
Sep 3, 2015
Sold by
Citimortgage Inc
Bought by
Rosenbaum Berel and Taub Issachard
Current Estimated Value
Purchase Details
Closed on
Mar 3, 2015
Sold by
Akyemah Nana and Tamana Kawada K
Bought by
Citimortgage Inc
Purchase Details
Closed on
Sep 26, 2007
Sold by
Reddick Diane H and Reddick James
Bought by
Akyemah Nana and Ameyaa Janet
Home Financials for this Owner
Home Financials are based on the most recent Mortgage that was taken out on this home.
Original Mortgage
$318,963
Interest Rate
6.49%
Mortgage Type
FHA
Purchase Details
Closed on
May 5, 2003
Sold by
Couram Danielle
Bought by
Reddick Diane
Purchase Details
Closed on
Sep 29, 1995
Sold by
Folston Geneva and Davis Daria D
Bought by
Couram Danielle Z
Purchase Details
Closed on
Oct 7, 1994
Sold by
Folston Geneva
Bought by
Folston Geneva and Davis Daria D
Purchase Details
Closed on
Jun 30, 1994
Sold by
Princeton Bank
Bought by
Folston Geneva
Create a Home Valuation Report for This Property
The Home Valuation Report is an in-depth analysis detailing your home's value as well as a comparison with similar homes in the area
Home Values in the Area
Average Home Value in this Area
Purchase History
| Date | Buyer | Sale Price | Title Company |
|---|---|---|---|
| Rosenbaum Berel | $120,000 | -- | |
| Citimortgage Inc | $1,000 | None Available | |
| Akyemah Nana | $324,000 | Chicago Title Insurance Co | |
| Reddick Diane | -- | -- | |
| Couram Danielle Z | $120,000 | Chicago Title Insurance Co | |
| Folston Geneva | -- | -- | |
| Folston Geneva | $58,140 | -- |
Source: Public Records
Mortgage History
| Date | Status | Borrower | Loan Amount |
|---|---|---|---|
| Previous Owner | Akyemah Nana | $318,963 |
Source: Public Records
Tax History Compared to Growth
Tax History
| Year | Tax Paid | Tax Assessment Tax Assessment Total Assessment is a certain percentage of the fair market value that is determined by local assessors to be the total taxable value of land and additions on the property. | Land | Improvement |
|---|---|---|---|---|
| 2025 | $4,696 | $56,900 | $49,500 | $7,400 |
| 2024 | $9,896 | $56,900 | $49,500 | $7,400 |
| 2023 | $9,896 | $123,500 | $49,500 | $74,000 |
| 2022 | $9,805 | $123,500 | $49,500 | $74,000 |
| 2021 | $9,740 | $123,500 | $49,500 | $74,000 |
| 2020 | $9,684 | $123,500 | $49,500 | $74,000 |
| 2019 | $9,496 | $123,500 | $49,500 | $74,000 |
| 2018 | $9,401 | $123,500 | $49,500 | $74,000 |
| 2017 | $9,344 | $123,500 | $49,500 | $74,000 |
| 2016 | $9,333 | $123,500 | $49,500 | $74,000 |
| 2015 | $9,250 | $123,500 | $49,500 | $74,000 |
| 2014 | $9,104 | $123,500 | $49,500 | $74,000 |
Source: Public Records
Map
Nearby Homes
- 1473 Center St
- 1451 Bond St
- 146 Williamson Ave
- 1406 Maple Ave
- 1414 Boa Place Unit 2
- 1488 Highland Ave
- 1444 N Broad St
- 1470B Liberty Ave
- 1451 Franklin St
- 95 Keer Ave
- 91 Keer Ave Unit 95
- 315 Winans Ave
- 628 Us Highway 22 and 3
- 203-205 Hansbury Ave
- 207-209 Hansbury Ave
- 23 Crescent Ave Unit 25
- 86-88 Chancellor Ave
- 36 Hansbury Ave Unit 38
- 1435 Leslie St Unit 7
- 38 Hansbury Ave
- 148 Clark St
- 1481 Maple Ave
- 142 Clark St
- 1477 Maple Ave
- 1482 Maple Ave Unit 1
- 1482 Maple Ave Unit 1482
- 1482 Maple Ave
- 1482-1484 Maple Ave
- 1482 Maple Ave Unit 1484
- 151 Clark St
- 1478 Center St
- 147 Clark St
- 138 Clark St
- 138 Clark St Unit 1
- 1478 Maple Ave
- 1476 Center St
- 1473 Maple Ave
- 145 Clark St
- 1474 Maple Ave
- 1472 Center St