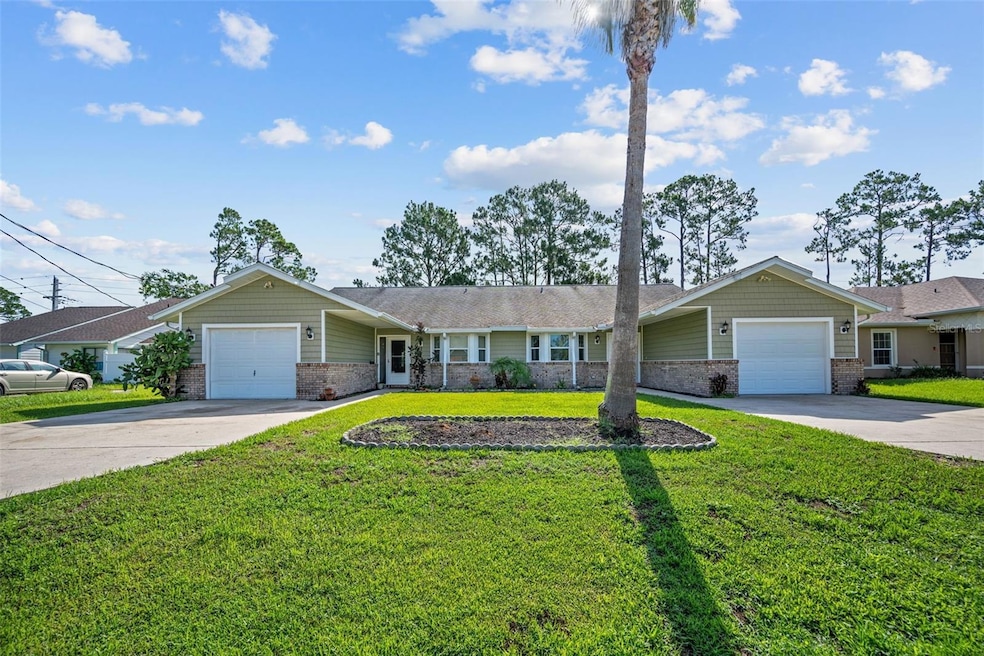
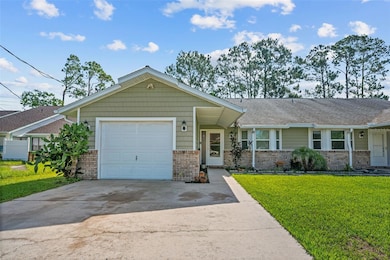
152 Fenimore Ln Unit A & B Palm Coast, FL 32137
Estimated payment $2,717/month
Highlights
- Vaulted Ceiling
- No HOA
- Sliding Doors
- Old Kings Elementary School Rated A-
- 2 Car Attached Garage
- Central Heating and Cooling System
About This Home
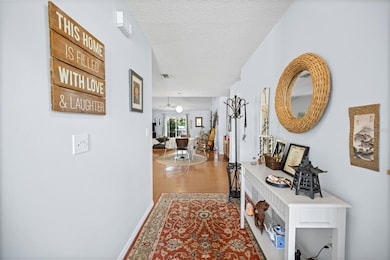
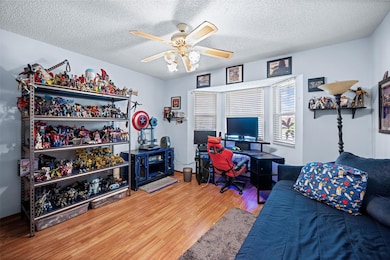
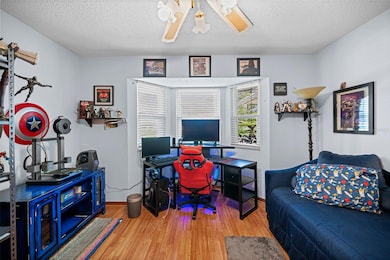
Explore this delightful duplex, offering two identical units, each boasting 2 bedrooms and 2 bathrooms, along with a convenient one-car garage. The thoughtfully designed split floor plan creates a spacious and comfortable living environment. The kitchen is fully outfitted with modern appliances and features bar top seating that flows effortlessly into the dining area, which is adjacent to the inviting living room. Enjoy easy access to the back patio through sliding glass doors from the living room. This prime location is just minutes from shopping, dining, and I-95, with multiple beautiful beaches nearby and a short drive north to the historic charm of St. Augustine and fast paced Daytona Beach.
Listing Agent
FLORIDA BEACHES REAL ESTATE Brokerage Phone: 386-986-6744 License #3258699 Listed on: 06/13/2025
Co-Listing Agent
FLORIDA BEACHES REAL ESTATE Brokerage Phone: 386-986-6744 License #3210657
Property Details
Home Type
- Multi-Family
Est. Annual Taxes
- $5,537
Year Built
- Built in 1989
Parking
- 2 Car Attached Garage
Home Design
- Duplex
- Slab Foundation
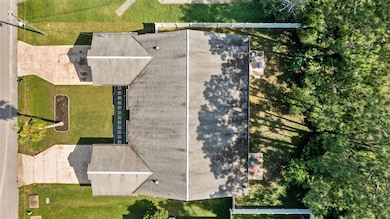
- Shingle Roof
- Vinyl Siding
Interior Spaces
- 2,833 Sq Ft Home
- Vaulted Ceiling
- Sliding Doors
- Laundry in Garage
Bedrooms and Bathrooms
- 4 Bedrooms
- 4 Bathrooms
Schools
- Belle Terre Elementary School
- Indian Trails Middle-Fc School
- Matanzas High School
Utilities
- Central Heating and Cooling System
- Heat Pump System
- Phone Available
- Cable TV Available
Additional Features
- Exterior Lighting
- 0.28 Acre Lot
Community Details
- No Home Owners Association
- 2 Units
- Palm Coast Sec 09 Subdivision
Listing and Financial Details
- Visit Down Payment Resource Website
- Legal Lot and Block 40 / 32
- Assessor Parcel Number 07-11-31-7009-00320-0400
Map
Home Values in the Area
Average Home Value in this Area
Tax History
| Year | Tax Paid | Tax Assessment Tax Assessment Total Assessment is a certain percentage of the fair market value that is determined by local assessors to be the total taxable value of land and additions on the property. | Land | Improvement |
|---|---|---|---|---|
| 2024 | $5,244 | $336,583 | $49,500 | $287,083 |
| 2023 | $5,244 | $261,789 | $0 | $0 |
| 2022 | $5,089 | $339,010 | $51,500 | $287,510 |
| 2021 | $4,322 | $235,037 | $27,000 | $208,037 |
| 2020 | $3,934 | $203,881 | $22,000 | $181,881 |
| 2019 | $3,560 | $177,946 | $20,400 | $157,546 |
| 2018 | $3,320 | $180,100 | $19,450 | $160,650 |
| 2017 | $2,977 | $156,352 | $17,500 | $138,852 |
| 2016 | $2,652 | $128,171 | $0 | $0 |
| 2015 | $2,393 | $116,519 | $0 | $0 |
| 2014 | $2,245 | $107,801 | $0 | $0 |
Property History
| Date | Event | Price | List to Sale | Price per Sq Ft |
|---|---|---|---|---|
| 10/14/2025 10/14/25 | Pending | -- | -- | -- |
| 09/05/2025 09/05/25 | Off Market | $429,000 | -- | -- |
| 07/28/2025 07/28/25 | Price Changed | $429,000 | -2.3% | $151 / Sq Ft |
| 06/13/2025 06/13/25 | For Sale | $439,000 | -- | $155 / Sq Ft |
Purchase History
| Date | Type | Sale Price | Title Company |
|---|---|---|---|
| Interfamily Deed Transfer | -- | Attorney | |
| Warranty Deed | $230,000 | Title Chain Inc | |
| Interfamily Deed Transfer | -- | Attorney | |
| Warranty Deed | -- | None Available | |
| Personal Reps Deed | -- | None Available | |
| Quit Claim Deed | -- | None Available |
Mortgage History
| Date | Status | Loan Amount | Loan Type |
|---|---|---|---|
| Open | $184,000 | New Conventional |
Source: Stellar MLS
MLS Number: FC310520
APN: 07-11-31-7009-00320-0400
Disclaimer: Certain information contained herein is derived from information provided by parties other than Homes.com. All information provided is deemed reliable, but is not guaranteed to be accurate and should be independently verified.
![]() IDX information is provided exclusively for personal, non-commercial use, and may not be used for any purpose other than to identify prospective properties consumers may be interested in purchasing. Information is deemed reliable but not guaranteed.
IDX information is provided exclusively for personal, non-commercial use, and may not be used for any purpose other than to identify prospective properties consumers may be interested in purchasing. Information is deemed reliable but not guaranteed.
Listing Information presented by local MLS brokerage: Ten-X - (888)-952-6393
