Estimated Value: $183,000 - $248,000
3
Beds
2
Baths
1,596
Sq Ft
$132/Sq Ft
Est. Value
About This Home
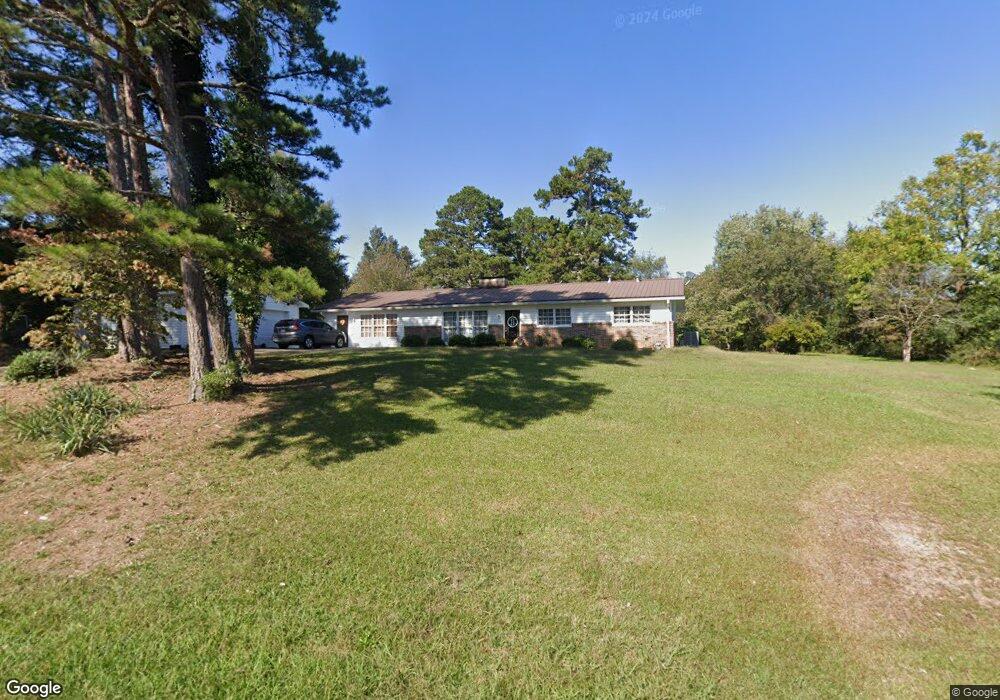
This home is located at 152 Franklin St, Menlo, GA 30731 and is currently estimated at $211,111, approximately $132 per square foot. 152 Franklin St is a home located in Chattooga County with nearby schools including Chattooga High School.
Ownership History
Date
Name
Owned For
Owner Type
Purchase Details
Closed on
Feb 9, 2024
Sold by
Dendy Timothy Chase
Bought by
Steiner Davis and Steiner Amanda Davis
Current Estimated Value
Home Financials for this Owner
Home Financials are based on the most recent Mortgage that was taken out on this home.
Original Mortgage
$137,464
Outstanding Balance
$135,057
Interest Rate
6.66%
Mortgage Type
New Conventional
Estimated Equity
$76,054
Purchase Details
Closed on
Jul 1, 2016
Sold by
Pepe Edward L
Bought by
Dendy Timothy Chase and Dendy Ashley Ann
Purchase Details
Closed on
Nov 6, 2009
Sold by
Pepe Edward L
Bought by
Pepe Edward L
Purchase Details
Closed on
Nov 10, 2006
Sold by
Pepe Edward L
Bought by
Clark Tim
Purchase Details
Closed on
Jul 25, 2006
Sold by
Not Provided
Bought by
Pepe Edward L and Pepe Parham Nettie A
Purchase Details
Closed on
Apr 18, 2006
Sold by
Not Provided
Bought by
Pepe Edward L and Pepe Parham Nettie A
Create a Home Valuation Report for This Property
The Home Valuation Report is an in-depth analysis detailing your home's value as well as a comparison with similar homes in the area
Home Values in the Area
Average Home Value in this Area
Purchase History
| Date | Buyer | Sale Price | Title Company |
|---|---|---|---|
| Steiner Davis | $140,000 | -- | |
| Dendy Timothy Chase | $88,000 | -- | |
| Pepe Edward L | -- | -- | |
| Clark Tim | $159,500 | -- | |
| Pepe Edward L | $98,000 | -- | |
| Pepe Edward L | $63,000 | -- |
Source: Public Records
Mortgage History
| Date | Status | Borrower | Loan Amount |
|---|---|---|---|
| Open | Steiner Davis | $137,464 |
Source: Public Records
Tax History Compared to Growth
Tax History
| Year | Tax Paid | Tax Assessment Tax Assessment Total Assessment is a certain percentage of the fair market value that is determined by local assessors to be the total taxable value of land and additions on the property. | Land | Improvement |
|---|---|---|---|---|
| 2024 | $1,506 | $55,956 | $3,520 | $52,436 |
| 2023 | $1,764 | $55,956 | $3,520 | $52,436 |
| 2022 | $1,156 | $43,197 | $2,542 | $40,655 |
| 2021 | $956 | $33,071 | $2,542 | $30,529 |
| 2020 | $995 | $33,071 | $2,542 | $30,529 |
| 2019 | $1,055 | $34,373 | $2,320 | $32,053 |
| 2018 | $1,007 | $34,228 | $2,320 | $31,908 |
| 2017 | $1,050 | $34,228 | $2,320 | $31,908 |
| 2016 | $952 | $34,227 | $2,320 | $31,907 |
| 2015 | -- | $30,225 | $2,320 | $27,905 |
| 2014 | -- | $30,225 | $2,320 | $27,905 |
| 2013 | -- | $30,225 | $2,320 | $27,905 |
Source: Public Records
Map
Nearby Homes
- 204 6th Ave
- 260 Ralphs Way
- 1558 Jamestown Rd
- 27 Acres Hwy 157
- 446 Jamestown Rd
- 62 Reece St
- 360 Edison St
- 3063 7th Ave
- 55 Reece St
- 455 Bell St
- 46 Buck Gardner Rd
- 223 S Brow Dr
- 195 County Road 844
- 11085 County Road 103
- 0 Yarborough Rd Unit 10537790
- 51 N Cedar St
- 144 County Road 919
- 98 Gadsden Ave
- 0 Georgia 157 Unit 7656573
- 0 Georgia 157 Unit RTC2624045