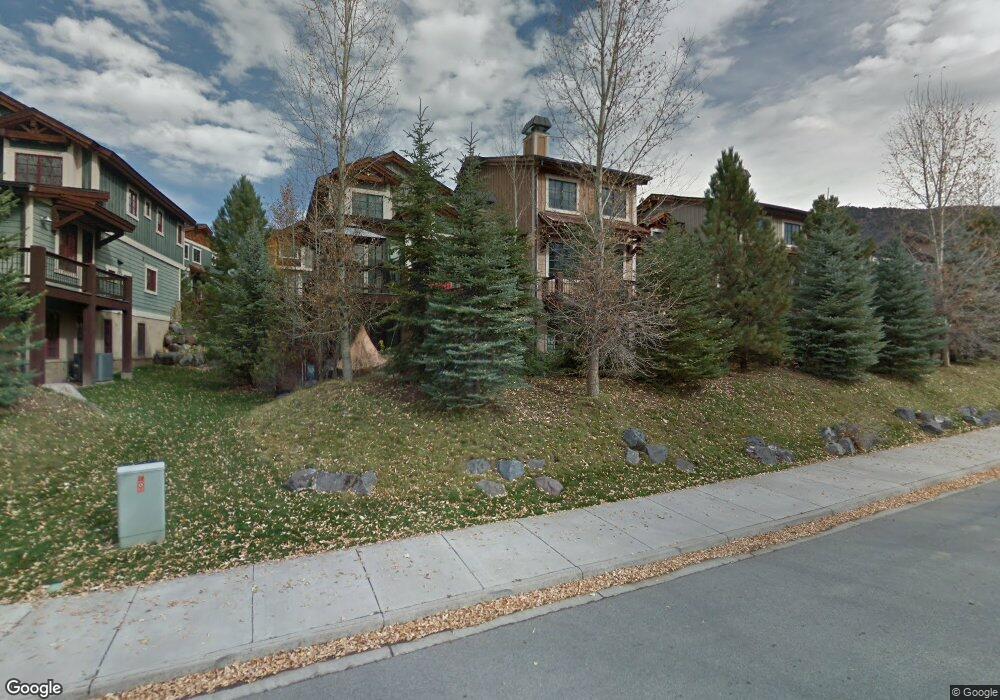
152 Juniper Trail Unit Firelight Carbondale, CO 81623
Estimated Value: $1,351,000 - $1,522,000
3
Beds
4
Baths
2,196
Sq Ft
$665/Sq Ft
Est. Value
About This Home
This home is located at 152 Juniper Trail Unit Firelight, Carbondale, CO 81623 and is currently estimated at $1,459,690, approximately $664 per square foot. 152 Juniper Trail Unit Firelight is a home located in Eagle County with nearby schools including Cornerstone Classical School and Waldorf School on the Roaring Fork.
Ownership History
Date
Name
Owned For
Owner Type
Purchase Details
Closed on
Sep 8, 2017
Sold by
The Gailen B Smith Family Trust
Bought by
Reisman Arthur Gerald and Reisman Lisa
Current Estimated Value
Home Financials for this Owner
Home Financials are based on the most recent Mortgage that was taken out on this home.
Original Mortgage
$479,200
Outstanding Balance
$387,173
Interest Rate
2.75%
Mortgage Type
Adjustable Rate Mortgage/ARM
Estimated Equity
$1,072,517
Purchase Details
Closed on
Dec 11, 2013
Sold by
Hill Street Llc
Bought by
The Gailen B Smith Family Trust
Purchase Details
Closed on
Dec 12, 2008
Sold by
Smith Gailen B and Smith Pamela Wendi D
Bought by
Hill Street Llc
Purchase Details
Closed on
Jul 3, 2008
Sold by
Blue Ridge Investments Ltd
Bought by
Smith Gailen B and Smith Pamela Wendi D
Create a Home Valuation Report for This Property
The Home Valuation Report is an in-depth analysis detailing your home's value as well as a comparison with similar homes in the area
Home Values in the Area
Average Home Value in this Area
Purchase History
| Date | Buyer | Sale Price | Title Company |
|---|---|---|---|
| Reisman Arthur Gerald | $599,000 | Land Title Guarantee Company | |
| The Gailen B Smith Family Trust | -- | None Available | |
| Hill Street Llc | -- | None Available | |
| Smith Gailen B | $872,860 | Stewart Title |
Source: Public Records
Mortgage History
| Date | Status | Borrower | Loan Amount |
|---|---|---|---|
| Open | Reisman Arthur Gerald | $479,200 |
Source: Public Records
Tax History Compared to Growth
Tax History
| Year | Tax Paid | Tax Assessment Tax Assessment Total Assessment is a certain percentage of the fair market value that is determined by local assessors to be the total taxable value of land and additions on the property. | Land | Improvement |
|---|---|---|---|---|
| 2024 | $5,351 | $71,680 | $8,540 | $63,140 |
| 2023 | $5,351 | $71,680 | $8,540 | $63,140 |
| 2022 | $4,193 | $51,980 | $6,170 | $45,810 |
| 2021 | $4,309 | $53,480 | $6,350 | $47,130 |
| 2020 | $3,448 | $44,910 | $5,320 | $39,590 |
| 2019 | $3,480 | $44,910 | $5,320 | $39,590 |
| 2018 | $3,619 | $46,260 | $5,480 | $40,780 |
| 2017 | $3,427 | $46,260 | $5,480 | $40,780 |
| 2016 | $3,265 | $43,300 | $5,120 | $38,180 |
| 2015 | -- | $43,300 | $5,120 | $38,180 |
| 2014 | $2,235 | $31,170 | $3,660 | $27,510 |
Source: Public Records
Map
Nearby Homes
- 145 Juniper Trail
- 140 Juniper Trail Unit 140
- 201 Tree Farm Dr Unit The Creekside
- 201 Tree Farm Dr Unit All Parcels
- 201 Tree Farm Dr Unit The Lakeview
- TBD Tree Farm Dr Unit A4 - 201
- TBD Tree Farm Dr Unit A1-302
- TBD Tree Farm Dr Unit A2 - 301
- TBD Tree Farm Dr Unit A4 - 202
- TBD Tree Farm Dr Unit A1-202
- TBD Tree Farm Dr Unit The Edge at Tree Far
- TBD Tree Farm Dr Unit A1-203
- TBD Tree Farm Dr Unit A3 - 301
- TBD Tree Farm Dr Unit A1-301
- TBD Tree Farm Dr Unit A3 -201
- TBD Tree Farm Dr Unit A-2 302
- TBD Tree Farm Dr Unit A2-201
- TBD Tree Farm Dr Unit A1-201
- TBD Tree Farm Dr Unit A2-202
- TBD Tree Farm Dr Unit A4 - 301
- 152 Juniper Trail
- 154 Juniper Trail Unit 154
- 154 Juniper Trail Unit Skywatch
- 150 Juniper Trail Unit F150
- 150 Juniper Trail Unit Skywatch
- 150 Juniper Trail
- 156 Juniper Trail
- 156 Juniper Trail Unit Firelight
- 158 Juniper Trail Unit 158
- 158 Juniper Trail Unit Skywatch Floor Plan
- 158 Juniper Trail Unit Skywatch
- 142 Juniper Trail
- 144 Juniper Trail
- 144 Juniper Trail Unit Skywatch
- 158 Juniper Trail
- 142 Juniper Trail
- 142 Juniper Trail Unit Firelight
- 363 Park Meadows Ln
- 160 Juniper Trail
- 160 Juniper Trail Unit Skywatch