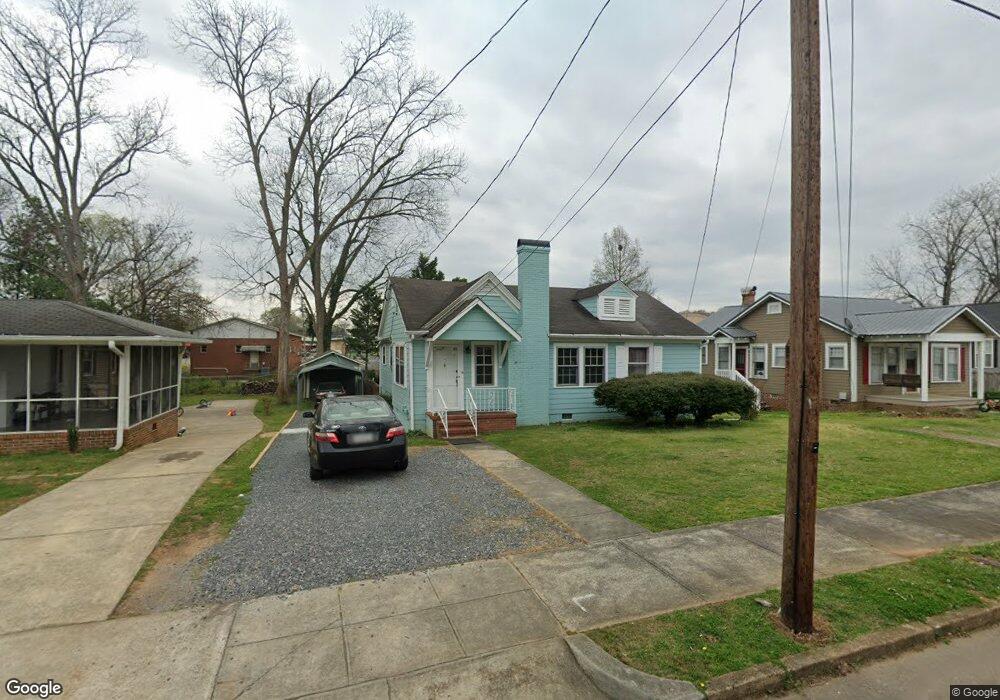
152 Marshall St Cedartown, GA 30125
Estimated Value: $167,978 - $194,000
2
Beds
2
Baths
1,588
Sq Ft
$113/Sq Ft
Est. Value
About This Home
This home is located at 152 Marshall St, Cedartown, GA 30125 and is currently estimated at $178,745, approximately $112 per square foot. 152 Marshall St is a home located in Polk County with nearby schools including Cedar Christian School and Vineyard Harvester Christian Academy.
Ownership History
Date
Name
Owned For
Owner Type
Purchase Details
Closed on
Jun 12, 2020
Sold by
Brooks Judy W
Bought by
Perez Brandy P Roblero
Current Estimated Value
Home Financials for this Owner
Home Financials are based on the most recent Mortgage that was taken out on this home.
Original Mortgage
$92,297
Outstanding Balance
$81,814
Interest Rate
3.2%
Mortgage Type
FHA
Estimated Equity
$96,931
Purchase Details
Closed on
Aug 24, 2001
Sold by
Worsham Mildred B and Worsham* Amuel C
Bought by
Brooks Judy W and Newton Kathy W
Purchase Details
Closed on
Mar 7, 2000
Sold by
Worsham Mildred B
Bought by
Worsham Mildred B and Worsham Samuel C
Purchase Details
Closed on
Oct 16, 1998
Sold by
Johnson Joy F and Johnson K
Bought by
Brown Jennie E
Purchase Details
Closed on
Jan 3, 1992
Sold by
Whitehead James H
Bought by
Rood Joy P
Purchase Details
Closed on
Apr 3, 1982
Sold by
Whitehead J Hampton
Bought by
Whitehead James H
Purchase Details
Closed on
May 9, 1964
Bought by
Whitehead J Hampton
Create a Home Valuation Report for This Property
The Home Valuation Report is an in-depth analysis detailing your home's value as well as a comparison with similar homes in the area
Home Values in the Area
Average Home Value in this Area
Purchase History
| Date | Buyer | Sale Price | Title Company |
|---|---|---|---|
| Perez Brandy P Roblero | $94,000 | -- | |
| Brooks Judy W | -- | -- | |
| Worsham Mildred B | -- | -- | |
| Brown Jennie E | $76,500 | -- | |
| Rood Joy P | -- | -- | |
| Rood Joy P | $31,500 | -- | |
| Whitehead James H | -- | -- | |
| Whitehead J Hampton | -- | -- |
Source: Public Records
Mortgage History
| Date | Status | Borrower | Loan Amount |
|---|---|---|---|
| Open | Perez Brandy P Roblero | $92,297 |
Source: Public Records
Tax History Compared to Growth
Tax History
| Year | Tax Paid | Tax Assessment Tax Assessment Total Assessment is a certain percentage of the fair market value that is determined by local assessors to be the total taxable value of land and additions on the property. | Land | Improvement |
|---|---|---|---|---|
| 2024 | $2,081 | $67,203 | $2,720 | $64,483 |
| 2023 | $1,449 | $43,163 | $2,720 | $40,443 |
| 2022 | $834 | $37,160 | $2,720 | $34,440 |
| 2021 | $845 | $37,160 | $2,720 | $34,440 |
| 2020 | $492 | $33,808 | $2,720 | $31,088 |
| 2019 | $338 | $25,928 | $2,591 | $23,337 |
| 2018 | $326 | $25,184 | $2,591 | $22,593 |
| 2017 | $318 | $25,184 | $2,591 | $22,593 |
| 2016 | $306 | $24,747 | $2,591 | $22,156 |
| 2015 | $306 | $24,724 | $2,591 | $22,133 |
| 2014 | $307 | $24,724 | $2,591 | $22,133 |
Source: Public Records
Map
Nearby Homes
- 144 Marshall St
- 328 Mountain Home Rd
- 601 Mountain Home Rd
- 228 Marshall St
- 214 Victoria Ave
- 408 N College St
- 305 N Cave Spring St
- 421 Wissahickon Ave
- 208 Highland Ave
- 258 Chestnut St
- 607 N College St
- 328 330 Stubbs
- 309 Walnut St
- 605 W Girard Ave
- 254 E Girard Ave
- 443 N Cave Spring St
- 214 Jule Peek Ave
- 217 E Gibson St
- 537 Fletcher St
- 427 Park St
- 156 Marshall St
- 148 Marshall St
- 162 Marshall St
- 146 Marshall St
- 151 N Main St
- 157 N Main St
- 153 Marshall St
- 159 Marshall St
- 161 Marshall St
- 147 Marshall St
- 163 Marshall St
- 143 Marshall St
- 168 Marshall St
- 140 Marshall St
- 165 Marshall St
- 139 Marshall St
- 137 Marshall St
- 167 Marshall St
- 130 Marshall St
- 160 N College St