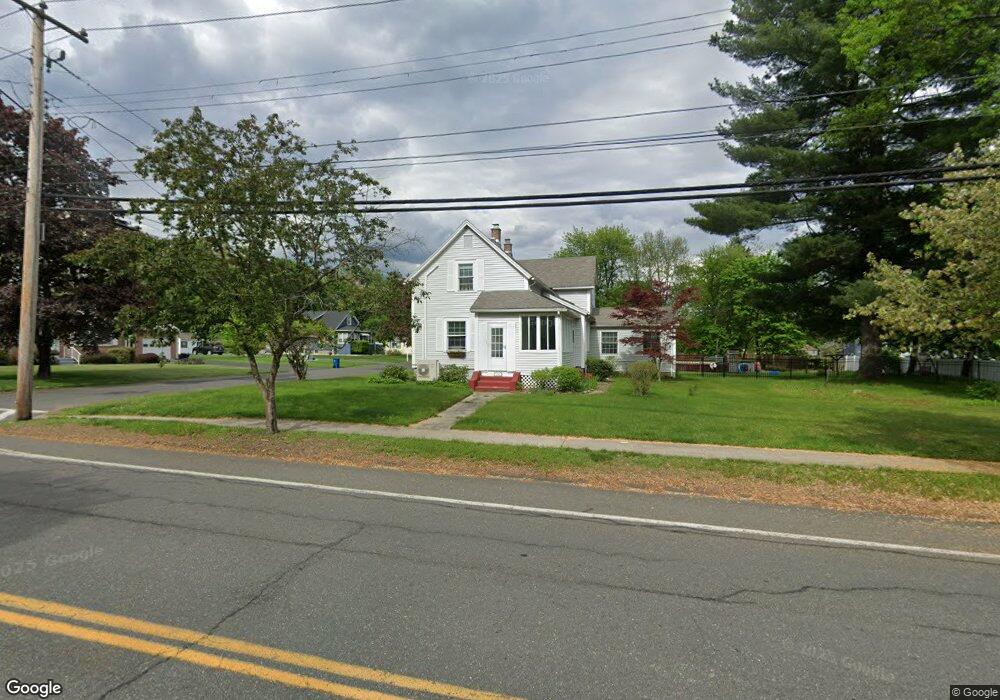
152 Piper Rd West Springfield, MA 01089
Estimated Value: $397,309 - $438,000
4
Beds
2
Baths
2,126
Sq Ft
$199/Sq Ft
Est. Value
About This Home
This home is located at 152 Piper Rd, West Springfield, MA 01089 and is currently estimated at $423,827, approximately $199 per square foot. 152 Piper Rd is a home located in Hampden County with nearby schools including West Springfield High School and St Thomas The Apostle School.
Ownership History
Date
Name
Owned For
Owner Type
Purchase Details
Closed on
Feb 21, 1997
Sold by
Davis Robert A
Bought by
Meserve Mark E and Meserve Suzanne Z
Current Estimated Value
Home Financials for this Owner
Home Financials are based on the most recent Mortgage that was taken out on this home.
Original Mortgage
$90,000
Interest Rate
7.8%
Mortgage Type
Purchase Money Mortgage
Purchase Details
Closed on
Jul 20, 1992
Sold by
Messier Jerome M
Bought by
Davis Robert A
Create a Home Valuation Report for This Property
The Home Valuation Report is an in-depth analysis detailing your home's value as well as a comparison with similar homes in the area
Home Values in the Area
Average Home Value in this Area
Purchase History
| Date | Buyer | Sale Price | Title Company |
|---|---|---|---|
| Meserve Mark E | $118,600 | -- | |
| Davis Robert A | $120,000 | -- |
Source: Public Records
Mortgage History
| Date | Status | Borrower | Loan Amount |
|---|---|---|---|
| Open | Davis Robert A | $86,075 | |
| Closed | Davis Robert A | $20,000 | |
| Closed | Davis Robert A | $90,000 |
Source: Public Records
Tax History
| Year | Tax Paid | Tax Assessment Tax Assessment Total Assessment is a certain percentage of the fair market value that is determined by local assessors to be the total taxable value of land and additions on the property. | Land | Improvement |
|---|---|---|---|---|
| 2025 | $4,967 | $334,000 | $121,600 | $212,400 |
| 2024 | $4,684 | $316,300 | $121,600 | $194,700 |
| 2023 | $4,468 | $287,500 | $121,600 | $165,900 |
| 2022 | $4,055 | $257,300 | $110,600 | $146,700 |
| 2021 | $3,740 | $221,300 | $89,700 | $131,600 |
| 2020 | $3,755 | $221,000 | $89,700 | $131,300 |
| 2019 | $3,748 | $221,000 | $89,700 | $131,300 |
| 2018 | $3,768 | $221,000 | $89,700 | $131,300 |
| 2017 | $3,768 | $221,000 | $89,700 | $131,300 |
| 2016 | $3,663 | $215,600 | $84,300 | $131,300 |
| 2015 | $3,592 | $211,400 | $82,500 | $128,900 |
| 2014 | $771 | $187,000 | $82,500 | $104,500 |
Source: Public Records
Map
Nearby Homes
Your Personal Tour Guide
Ask me questions while you tour the home.