Estimated Value: $1,013,000 - $1,450,305
2
Beds
2
Baths
1,001
Sq Ft
$1,288/Sq Ft
Est. Value
About This Home
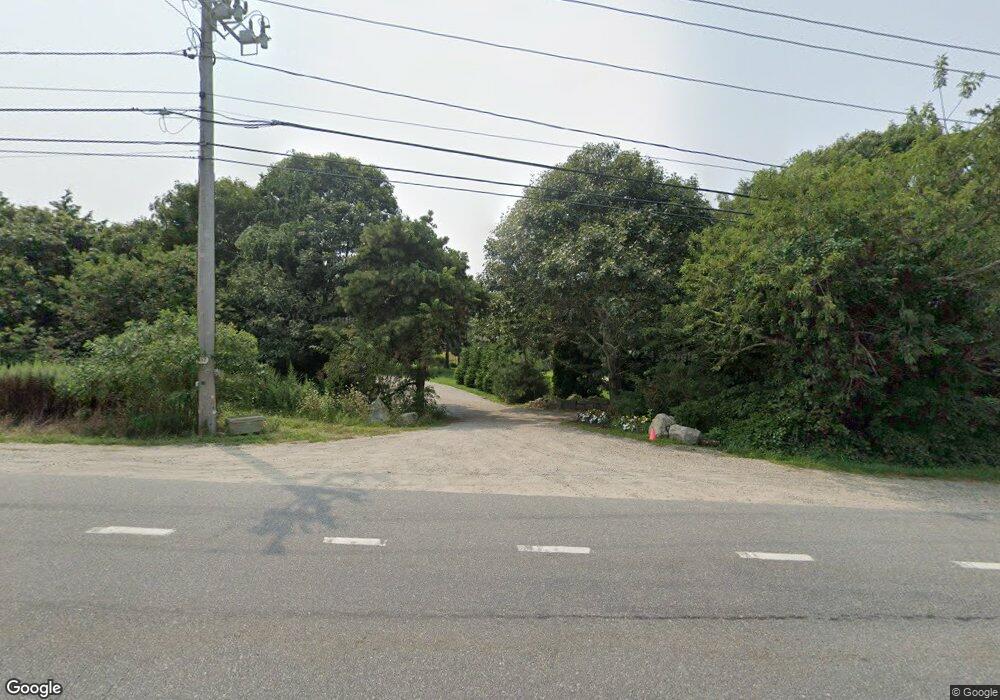
This home is located at 152 Route 6, Truro, MA 2666 and is currently estimated at $1,288,826, approximately $1,287 per square foot. 152 Route 6 is a home located in Barnstable County.
Ownership History
Date
Name
Owned For
Owner Type
Purchase Details
Closed on
Jun 21, 2004
Sold by
Rice John B
Bought by
Rice Jonathan E C and Rice Justine Maria
Current Estimated Value
Home Financials for this Owner
Home Financials are based on the most recent Mortgage that was taken out on this home.
Original Mortgage
$300,000
Outstanding Balance
$145,689
Interest Rate
6.12%
Mortgage Type
Purchase Money Mortgage
Estimated Equity
$1,143,137
Create a Home Valuation Report for This Property
The Home Valuation Report is an in-depth analysis detailing your home's value as well as a comparison with similar homes in the area
Home Values in the Area
Average Home Value in this Area
Purchase History
| Date | Buyer | Sale Price | Title Company |
|---|---|---|---|
| Rice Jonathan E C | $375,000 | -- | |
| Rice Jonathan E C | $375,000 | -- |
Source: Public Records
Mortgage History
| Date | Status | Borrower | Loan Amount |
|---|---|---|---|
| Open | Rice Jonathan E C | $300,000 | |
| Closed | Rice Jonathan E C | $300,000 |
Source: Public Records
Tax History Compared to Growth
Tax History
| Year | Tax Paid | Tax Assessment Tax Assessment Total Assessment is a certain percentage of the fair market value that is determined by local assessors to be the total taxable value of land and additions on the property. | Land | Improvement |
|---|---|---|---|---|
| 2025 | $7,341 | $1,187,800 | $228,700 | $959,100 |
| 2024 | $6,899 | $1,151,800 | $226,500 | $925,300 |
| 2023 | $6,344 | $970,100 | $196,900 | $773,200 |
| 2022 | $5,821 | $753,100 | $169,700 | $583,400 |
| 2021 | $5,246 | $710,800 | $169,700 | $541,100 |
| 2020 | $5,171 | $705,400 | $168,000 | $537,400 |
| 2019 | $4,560 | $612,100 | $168,000 | $444,100 |
| 2018 | $4,253 | $577,100 | $168,000 | $409,100 |
| 2017 | $3,905 | $559,500 | $168,000 | $391,500 |
| 2016 | $3,755 | $554,700 | $166,400 | $388,300 |
| 2015 | $3,603 | $543,400 | $164,800 | $378,600 |
Source: Public Records
Map
Nearby Homes