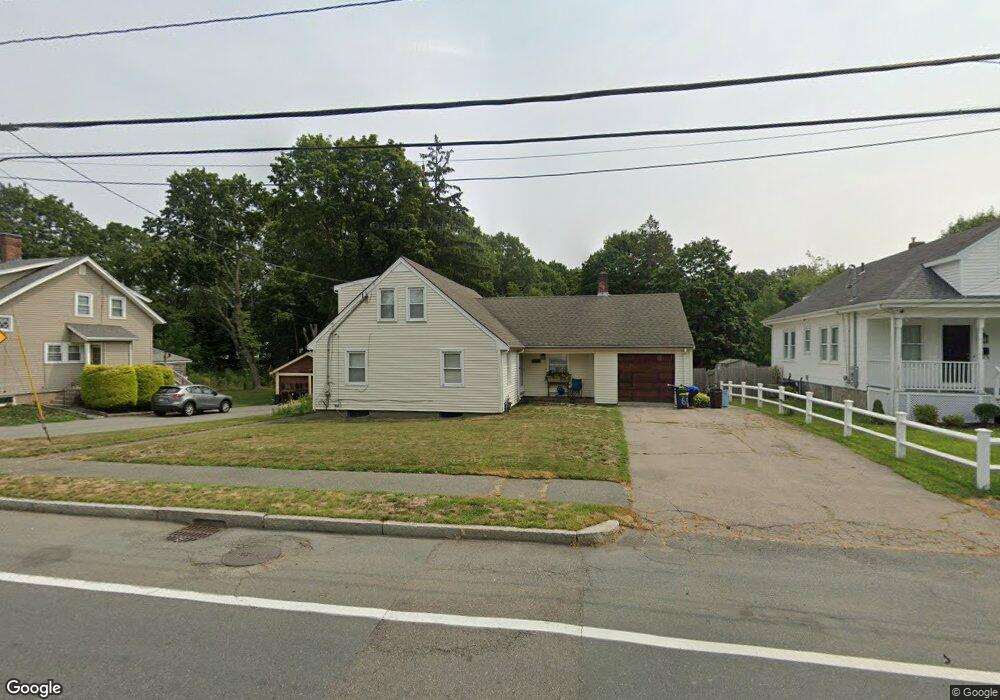
152 West St Brockton, MA 02301
Estimated Value: $583,000 - $631,000
4
Beds
3
Baths
1,859
Sq Ft
$325/Sq Ft
Est. Value
About This Home
This home is located at 152 West St, Brockton, MA 02301 and is currently estimated at $604,480, approximately $325 per square foot. 152 West St is a home located in Plymouth County with nearby schools including Manthala George Jr. School, Hancock Elementary School, and Louis F Angelo Elementary School.
Ownership History
Date
Name
Owned For
Owner Type
Purchase Details
Closed on
May 19, 1993
Sold by
Chase Home Mtg Corp
Bought by
Petti Matthew A
Current Estimated Value
Home Financials for this Owner
Home Financials are based on the most recent Mortgage that was taken out on this home.
Original Mortgage
$87,850
Interest Rate
7.54%
Mortgage Type
Purchase Money Mortgage
Purchase Details
Closed on
Feb 19, 1993
Sold by
Owens Harold F
Bought by
Banker Tr Co T
Create a Home Valuation Report for This Property
The Home Valuation Report is an in-depth analysis detailing your home's value as well as a comparison with similar homes in the area
Purchase History
| Date | Buyer | Sale Price | Title Company |
|---|---|---|---|
| Petti Matthew A | $92,500 | -- | |
| Banker Tr Co T | $102,998 | -- |
Source: Public Records
Mortgage History
| Date | Status | Borrower | Loan Amount |
|---|---|---|---|
| Open | Banker Tr Co T | $46,000 | |
| Open | Banker Tr Co T | $108,000 | |
| Closed | Banker Tr Co T | $87,850 |
Source: Public Records
Tax History
| Year | Tax Paid | Tax Assessment Tax Assessment Total Assessment is a certain percentage of the fair market value that is determined by local assessors to be the total taxable value of land and additions on the property. | Land | Improvement |
|---|---|---|---|---|
| 2025 | $5,957 | $491,900 | $167,400 | $324,500 |
| 2024 | $5,849 | $486,600 | $167,400 | $319,200 |
| 2023 | $5,459 | $420,600 | $133,900 | $286,700 |
| 2022 | $5,174 | $370,400 | $122,400 | $248,000 |
| 2021 | $7,445 | $344,800 | $109,200 | $235,600 |
| 2020 | $5,446 | $359,500 | $104,600 | $254,900 |
| 2019 | $7,267 | $338,100 | $97,000 | $241,100 |
| 2018 | $4,771 | $297,100 | $97,000 | $200,100 |
| 2017 | $4,626 | $287,300 | $97,000 | $190,300 |
| 2016 | $4,618 | $266,000 | $93,800 | $172,200 |
| 2015 | $4,378 | $241,200 | $93,800 | $147,400 |
| 2014 | $4,271 | $235,600 | $93,800 | $141,800 |
Source: Public Records
Map
Nearby Homes
- 47 N Belcher Ave
- 109 Lenox St
- 69 W Elm Terrace Unit 1
- 131 Moraine St
- 29 Auna Dr Unit 3
- 433 W Elm St Unit 2
- 11 Auna Dr Unit 6
- 425 W Elm St Unit 7
- 436 Pleasant St
- 18 Belmont Place
- 193 Boylston St
- 77 Highland Terrace
- 130 Braemoor Rd
- 75 Colonel Bell Dr Unit 77-11
- 81 Colonel Bell Dr Unit 9
- 97 Colonel Bell Dr Unit 8
- 155 Rockland Dr
- 18 Sagamore Rd
- 48 Simmons Ave
- 66 Cross Ave
Your Personal Tour Guide
Ask me questions while you tour the home.