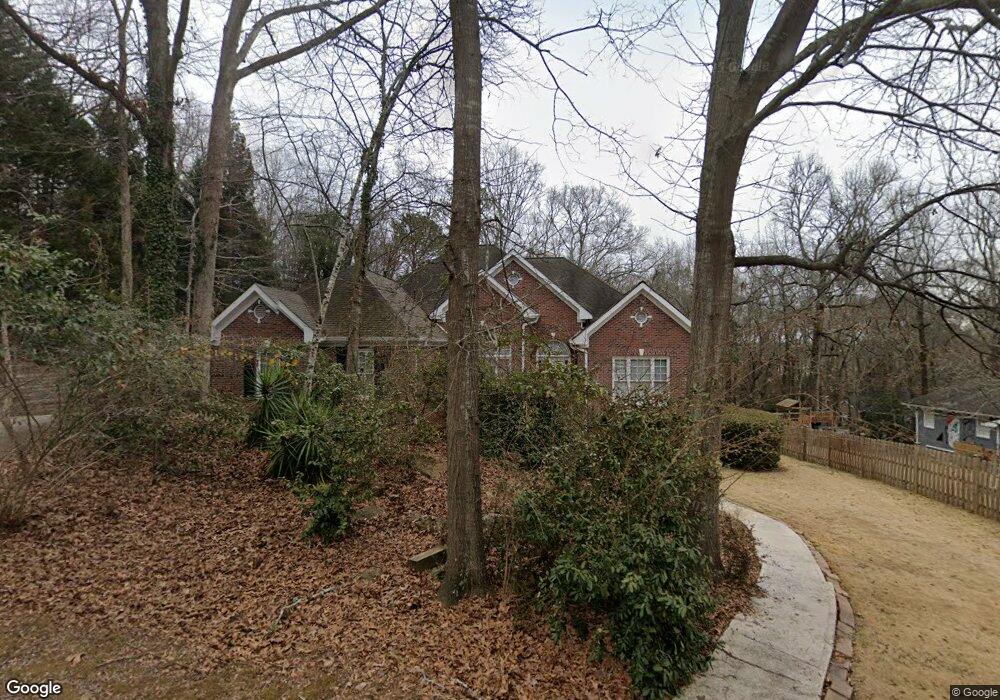
152 Witherspoon Ct Athens, GA 30606
Five Points NeighborhoodEstimated Value: $890,000 - $1,689,000
4
Beds
3
Baths
4,310
Sq Ft
$266/Sq Ft
Est. Value
About This Home
This home is located at 152 Witherspoon Ct, Athens, GA 30606 and is currently estimated at $1,146,737, approximately $266 per square foot. 152 Witherspoon Ct is a home located in Clarke County with nearby schools including Barrow Elementary School, Clarke Middle School, and Clarke Central High School.
Ownership History
Date
Name
Owned For
Owner Type
Purchase Details
Closed on
Apr 26, 2004
Sold by
Henley Rhodes Living Trust By
Bought by
Henley Rhodes Living Trust By Trustee
Current Estimated Value
Purchase Details
Closed on
May 23, 2002
Sold by
Henley Edna C and Rhodes Edwin J
Bought by
Henley Rhodes Living Trust By Trustee
Purchase Details
Closed on
Aug 14, 2000
Sold by
Rhodes Henley E and Rhodes Edwin J
Bought by
Henley Rhodes Living Trust By Trustees
Purchase Details
Closed on
Jul 10, 2000
Sold by
Martin Michael S
Bought by
Rhodes Henley E and Rhodes Edwin J
Purchase Details
Closed on
Jan 6, 2000
Sold by
Hang Hsinwei and Nanchu Li
Bought by
Martin Michael S
Purchase Details
Closed on
Aug 7, 1996
Sold by
Widner Alta Morris
Bought by
Hang Hsinwei and Nanchu Li
Purchase Details
Closed on
Apr 7, 1995
Sold by
Widner Widner E and Widner Alta M
Bought by
Widner Alta M
Create a Home Valuation Report for This Property
The Home Valuation Report is an in-depth analysis detailing your home's value as well as a comparison with similar homes in the area
Home Values in the Area
Average Home Value in this Area
Purchase History
| Date | Buyer | Sale Price | Title Company |
|---|---|---|---|
| Henley Rhodes Living Trust By Trustee | -- | -- | |
| Henley Rhodes Living Trust By Trustee | -- | -- | |
| Henley Edna C | -- | -- | |
| Henley Rhodes Living Trust By Trustees | -- | -- | |
| Rhodes Henley E | $255,600 | -- | |
| Martin Michael S | $30,000 | -- | |
| Hang Hsinwei | $160,000 | -- | |
| Widner Alta M | -- | -- |
Source: Public Records
Tax History Compared to Growth
Tax History
| Year | Tax Paid | Tax Assessment Tax Assessment Total Assessment is a certain percentage of the fair market value that is determined by local assessors to be the total taxable value of land and additions on the property. | Land | Improvement |
|---|---|---|---|---|
| 2025 | $6,418 | $395,042 | $60,000 | $335,042 |
| 2024 | $6,418 | $364,824 | $60,000 | $304,824 |
| 2023 | $6,486 | $320,954 | $50,000 | $270,954 |
| 2022 | $5,794 | $280,129 | $50,000 | $230,129 |
| 2021 | $5,746 | $254,298 | $40,000 | $214,298 |
| 2020 | $5,571 | $241,494 | $40,000 | $201,494 |
| 2019 | $5,356 | $221,951 | $40,000 | $181,951 |
| 2018 | $4,830 | $184,213 | $40,000 | $144,213 |
| 2017 | $4,764 | $179,496 | $40,000 | $139,496 |
| 2016 | $4,651 | $171,409 | $40,000 | $131,409 |
| 2015 | $4,276 | $147,709 | $32,000 | $115,709 |
| 2014 | $4,211 | $143,048 | $28,000 | $115,048 |
Source: Public Records
Map
Nearby Homes
- 253 Sleepy Creek Dr
- 185 Eaglewood Way
- 2019 S Lumpkin St
- 105 Princeton Mill Rd
- 275 Westview Dr
- 275 Davis Estates Rd
- 262 Rhodes Dr
- 104 W Lake Ct
- 204 Gran Ellen Dr
- 145 Heatherwood Ln
- 213 Highpointe Ln
- 265 Annes Ct
- 299 Kennington Dr
- 780 Macon Hwy
- 128 Habersham Dr
- 164 Plum Nelly Rd
- 277 Highpointe Ln
- 183 Parkway Dr
- 192 Witherspoon Ct
- 155 Witherspoon Ct
- 155 Witherspoon Rd
- 165 Witherspoon Rd
- 0 Witherspoon Ct
- 175 Witherspoon Rd
- 135 Witherspoon Ct
- 145 Witherspoon Rd
- 197 Witherspoon Ct
- 0 Witherspoon Rd Unit 7212176
- 0 Witherspoon Rd Unit 8159002
- 0 Witherspoon Rd Unit 8135167
- 0 Witherspoon Rd
- 250 Old Princeton Rd
- 360 Old Princeton Rd
- 185 Witherspoon Rd
- 150 Witherspoon Rd
- 125 Witherspoon Rd
- 158 Witherspoon Rd
- 170 Witherspoon Rd