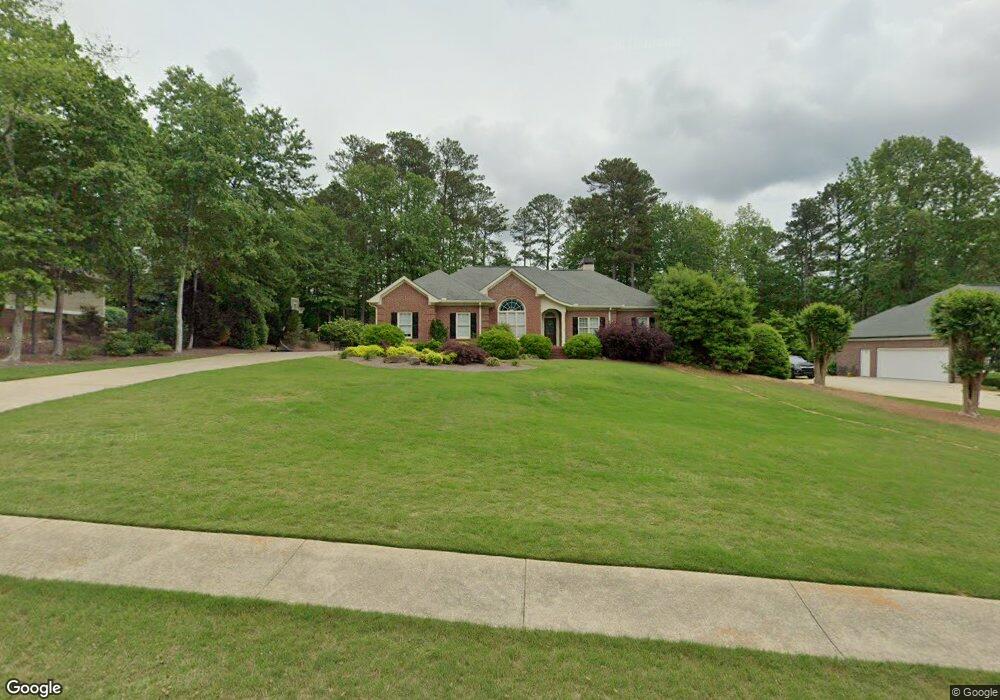
152 Wynridge Dr Carrollton, GA 30116
Estimated Value: $379,000 - $481,000
3
Beds
3
Baths
2,207
Sq Ft
$197/Sq Ft
Est. Value
About This Home
This home is located at 152 Wynridge Dr, Carrollton, GA 30116 and is currently estimated at $434,349, approximately $196 per square foot. 152 Wynridge Dr is a home located in Carroll County with nearby schools including Central Elementary School, Central Middle School, and Central High School.
Ownership History
Date
Name
Owned For
Owner Type
Purchase Details
Closed on
Aug 18, 2021
Sold by
Gresham Jeffrey Ward
Bought by
Studdard James Travis
Current Estimated Value
Home Financials for this Owner
Home Financials are based on the most recent Mortgage that was taken out on this home.
Original Mortgage
$278,000
Outstanding Balance
$206,456
Interest Rate
2.7%
Mortgage Type
New Conventional
Estimated Equity
$227,893
Purchase Details
Closed on
Nov 3, 2020
Sold by
Horsley Jay M
Bought by
Gresham Jeffrey Ward and Gresham Margaret Joy
Purchase Details
Closed on
Jul 3, 2003
Sold by
Mcbride Michael S
Bought by
Horsley Jay M
Purchase Details
Closed on
Aug 11, 1994
Bought by
Mcbride Michael S
Purchase Details
Closed on
Jul 29, 1993
Bought by
Denhart
Create a Home Valuation Report for This Property
The Home Valuation Report is an in-depth analysis detailing your home's value as well as a comparison with similar homes in the area
Home Values in the Area
Average Home Value in this Area
Purchase History
| Date | Buyer | Sale Price | Title Company |
|---|---|---|---|
| Studdard James Travis | $347,500 | -- | |
| Gresham Jeffrey Ward | $299,000 | -- | |
| Horsley Jay M | $190,000 | -- | |
| Mcbride Michael S | $152,000 | -- | |
| Denhart | $14,500 | -- |
Source: Public Records
Mortgage History
| Date | Status | Borrower | Loan Amount |
|---|---|---|---|
| Open | Studdard James Travis | $278,000 |
Source: Public Records
Tax History Compared to Growth
Tax History
| Year | Tax Paid | Tax Assessment Tax Assessment Total Assessment is a certain percentage of the fair market value that is determined by local assessors to be the total taxable value of land and additions on the property. | Land | Improvement |
|---|---|---|---|---|
| 2025 | $3,676 | $181,148 | $13,000 | $168,148 |
| 2024 | $3,717 | $181,148 | $13,000 | $168,148 |
| 2023 | $3,717 | $165,664 | $13,000 | $152,664 |
| 2022 | $3,299 | $135,538 | $13,000 | $122,538 |
| 2021 | $839 | $117,873 | $13,000 | $104,873 |
| 2020 | $2,328 | $105,779 | $13,000 | $92,779 |
| 2019 | $2,183 | $96,968 | $13,000 | $83,968 |
| 2018 | $1,978 | $84,217 | $13,000 | $71,217 |
| 2017 | $1,983 | $84,217 | $13,000 | $71,217 |
| 2016 | $1,984 | $84,217 | $13,000 | $71,217 |
| 2015 | $1,972 | $77,272 | $11,200 | $66,072 |
| 2014 | $1,980 | $77,272 | $11,200 | $66,072 |
Source: Public Records
Map
Nearby Homes
- 197 Westbrook Rd
- 106 Victoria Way
- 106 Victoria Vining
- 143 Oak Leaf Dr Unit 163
- 143 Oak Leaf Dr
- 185 White Oak Ct
- 0 Clem Lowell Rd Unit 10479926
- 0 Clem Lowell Rd Unit 147578
- 0 Clem Lowell Rd Unit 7630669
- 252 Mink Hollow Dr
- 184 Whooping Creek Church Rd
- 213 Shady Valley Dr
- 2181 2201 Star Point
- 391 Foggy Bottom Dr
- 158 Foggy Bottom Dr
- 1745 Stripling Chapel Rd
- 2716 Georgia 16
- 39 Hampton Way
- 154 Wynridge Dr
- 138 Wynridge Dr Unit 14
- 138 Wynridge Dr
- 164 Wynridge Dr
- 9 Wynridge Ct
- 129 Wynridge Dr
- 159 Wynridge Dr
- 153 Wynridge Dr
- 2149 S Highway 16
- 93 Wynridge Dr
- 2137 S Highway 16
- 15 Wynridge Ct
- 190 Wynridge Dr
- 108 Wynridge Dr
- 20 Wynridge Ct
- 2121 S Highway 16
- 92 Wynridge Dr
- 183 Wynridge Dr
- 2189 S Highway 16
- 64 Mountain Brooke Dr