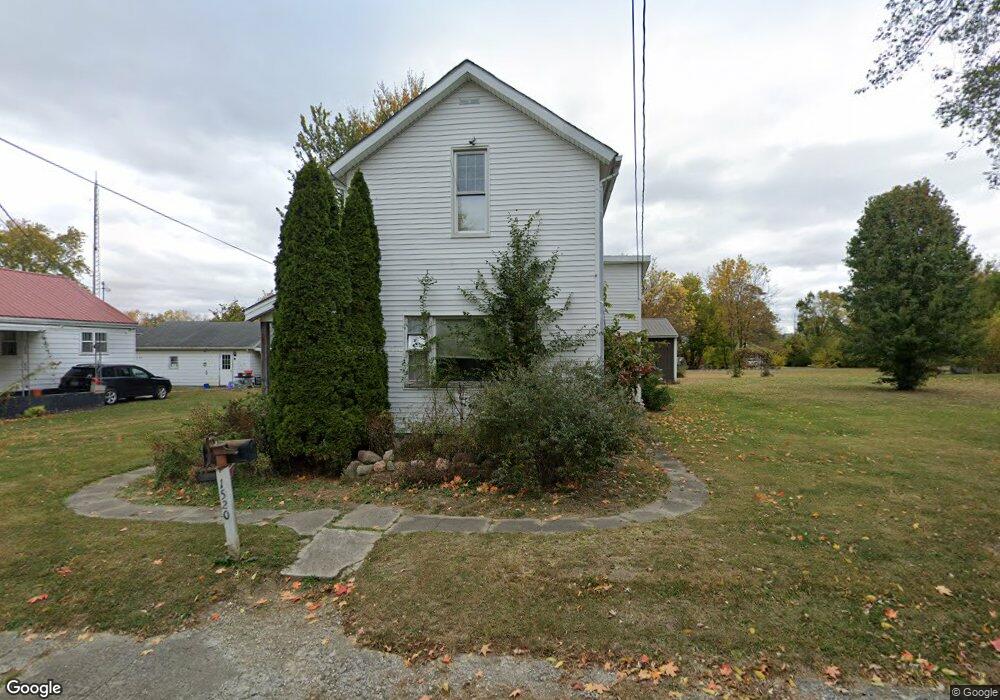
1520 B Ave New Castle, IN 47362
Estimated Value: $119,000 - $147,392
3
Beds
1
Bath
1,446
Sq Ft
$91/Sq Ft
Est. Value
About This Home
This home is located at 1520 B Ave, New Castle, IN 47362 and is currently estimated at $132,098, approximately $91 per square foot. 1520 B Ave is a home located in Henry County with nearby schools including Agape Learning Center.
Ownership History
Date
Name
Owned For
Owner Type
Purchase Details
Closed on
Feb 22, 2005
Sold by
Rose Willie G
Bought by
Rose Ii Willie G
Current Estimated Value
Home Financials for this Owner
Home Financials are based on the most recent Mortgage that was taken out on this home.
Original Mortgage
$22,000
Interest Rate
7.25%
Mortgage Type
Seller Take Back
Purchase Details
Closed on
Feb 11, 2005
Sold by
Fannie Mae
Bought by
Rose Willie G
Home Financials for this Owner
Home Financials are based on the most recent Mortgage that was taken out on this home.
Original Mortgage
$22,000
Interest Rate
7.25%
Mortgage Type
Seller Take Back
Create a Home Valuation Report for This Property
The Home Valuation Report is an in-depth analysis detailing your home's value as well as a comparison with similar homes in the area
Home Values in the Area
Average Home Value in this Area
Purchase History
| Date | Buyer | Sale Price | Title Company |
|---|---|---|---|
| Rose Ii Willie G | $22,000 | None Available | |
| Rose Willie G | -- | None Available |
Source: Public Records
Mortgage History
| Date | Status | Borrower | Loan Amount |
|---|---|---|---|
| Closed | Rose Ii Willie G | $22,000 |
Source: Public Records
Tax History Compared to Growth
Tax History
| Year | Tax Paid | Tax Assessment Tax Assessment Total Assessment is a certain percentage of the fair market value that is determined by local assessors to be the total taxable value of land and additions on the property. | Land | Improvement |
|---|---|---|---|---|
| 2024 | $1,036 | $103,600 | $12,800 | $90,800 |
| 2023 | $918 | $91,800 | $12,800 | $79,000 |
| 2022 | $802 | $79,800 | $12,800 | $67,000 |
| 2021 | $733 | $73,100 | $12,800 | $60,300 |
| 2020 | $769 | $70,800 | $12,800 | $58,000 |
| 2019 | $755 | $69,700 | $12,800 | $56,900 |
| 2018 | $724 | $69,200 | $12,800 | $56,400 |
| 2017 | $673 | $68,500 | $12,800 | $55,700 |
| 2016 | $655 | $67,300 | $12,800 | $54,500 |
| 2014 | $516 | $64,200 | $12,800 | $51,400 |
| 2013 | $516 | $61,900 | $12,800 | $49,100 |
Source: Public Records
Map
Nearby Homes