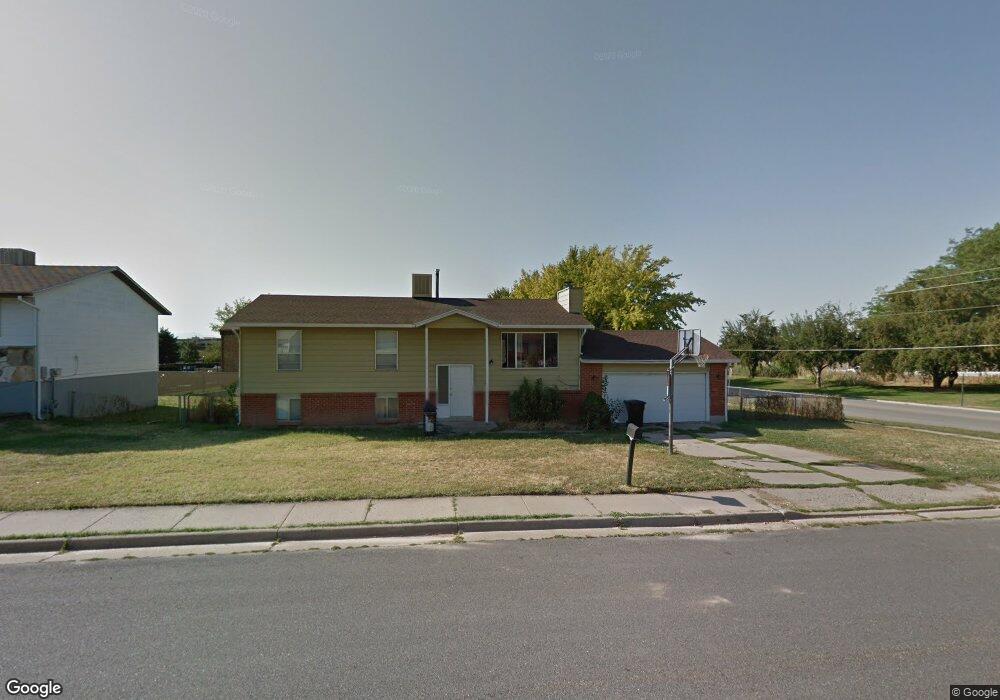
1520 E 1100 S Clearfield, UT 84015
Estimated Value: $361,000 - $443,487
5
Beds
3
Baths
1,166
Sq Ft
$359/Sq Ft
Est. Value
About This Home
This home is located at 1520 E 1100 S, Clearfield, UT 84015 and is currently estimated at $418,122, approximately $358 per square foot. 1520 E 1100 S is a home located in Davis County with nearby schools including South Clearfield Elementary School, North Davis Junior High School, and Northridge High School.
Ownership History
Date
Name
Owned For
Owner Type
Purchase Details
Closed on
Nov 21, 2025
Sold by
Okeefe Kenneth and Kelley-Okeefe Donya Lee
Bought by
Utah Home Buyers Llc
Current Estimated Value
Purchase Details
Closed on
Apr 28, 2016
Sold by
Keefe Kenneth O
Bought by
Keefe Kenneth O and Keefe Donya Lee Kelley
Purchase Details
Closed on
Dec 30, 2004
Sold by
Austin Theodore W
Bought by
Moore Daniel E
Home Financials for this Owner
Home Financials are based on the most recent Mortgage that was taken out on this home.
Original Mortgage
$124,245
Interest Rate
5.74%
Mortgage Type
FHA
Purchase Details
Closed on
Jun 9, 1999
Sold by
Austin Theodore W
Bought by
Austin Theodore W
Home Financials for this Owner
Home Financials are based on the most recent Mortgage that was taken out on this home.
Original Mortgage
$78,000
Interest Rate
7.01%
Create a Home Valuation Report for This Property
The Home Valuation Report is an in-depth analysis detailing your home's value as well as a comparison with similar homes in the area
Home Values in the Area
Average Home Value in this Area
Purchase History
| Date | Buyer | Sale Price | Title Company |
|---|---|---|---|
| Utah Home Buyers Llc | -- | Novation Title | |
| Keefe Kenneth O | -- | Inwest Title | |
| Keefe Kenneth O | -- | Inwest Title | |
| Moore Daniel E | -- | Equity Title Ins Agency Inc | |
| Austin Theodore W | -- | Mountain View Title & Escrow |
Source: Public Records
Mortgage History
| Date | Status | Borrower | Loan Amount |
|---|---|---|---|
| Previous Owner | Moore Daniel E | $124,245 | |
| Previous Owner | Austin Theodore W | $78,000 |
Source: Public Records
Tax History
| Year | Tax Paid | Tax Assessment Tax Assessment Total Assessment is a certain percentage of the fair market value that is determined by local assessors to be the total taxable value of land and additions on the property. | Land | Improvement |
|---|---|---|---|---|
| 2025 | $2,480 | $222,200 | $68,488 | $153,712 |
| 2024 | $2,206 | $199,100 | $65,479 | $133,621 |
| 2023 | $2,022 | $335,000 | $104,807 | $230,193 |
| 2022 | $2,081 | $186,450 | $60,141 | $126,309 |
| 2021 | $1,972 | $267,000 | $63,704 | $203,296 |
| 2020 | $1,718 | $231,000 | $53,549 | $177,451 |
| 2019 | $1,665 | $221,000 | $56,213 | $164,787 |
| 2018 | $1,539 | $199,000 | $47,400 | $151,600 |
| 2016 | $1,446 | $97,735 | $19,922 | $77,813 |
| 2015 | $1,306 | $84,205 | $19,922 | $64,283 |
| 2014 | $1,408 | $91,973 | $19,922 | $72,051 |
| 2013 | -- | $68,481 | $25,049 | $43,432 |
Source: Public Records
Map
Nearby Homes
- 1542 E 925 S
- 911 S 1500 E
- 1184 E Valhalla Dr
- 870 S 1625 E Unit A
- 1560 E 800 S Unit C
- 865 S 1650 E Unit A
- 1543 E 750 S Unit C5
- 1624 E 750 S Unit D-9
- 1021 E 1225 S Unit A
- 990 E 1150 S
- 2548 N 1150 W
- 876 S 1000 E
- 2949 N 1175 W
- 897 E 1000 S
- 1606 W 1960 N
- 1596 N Main St Unit 2
- 2320 N 1085 W
- 2298 N 1085 W
- 842 E 1000 S
- 1012 W 2525 N