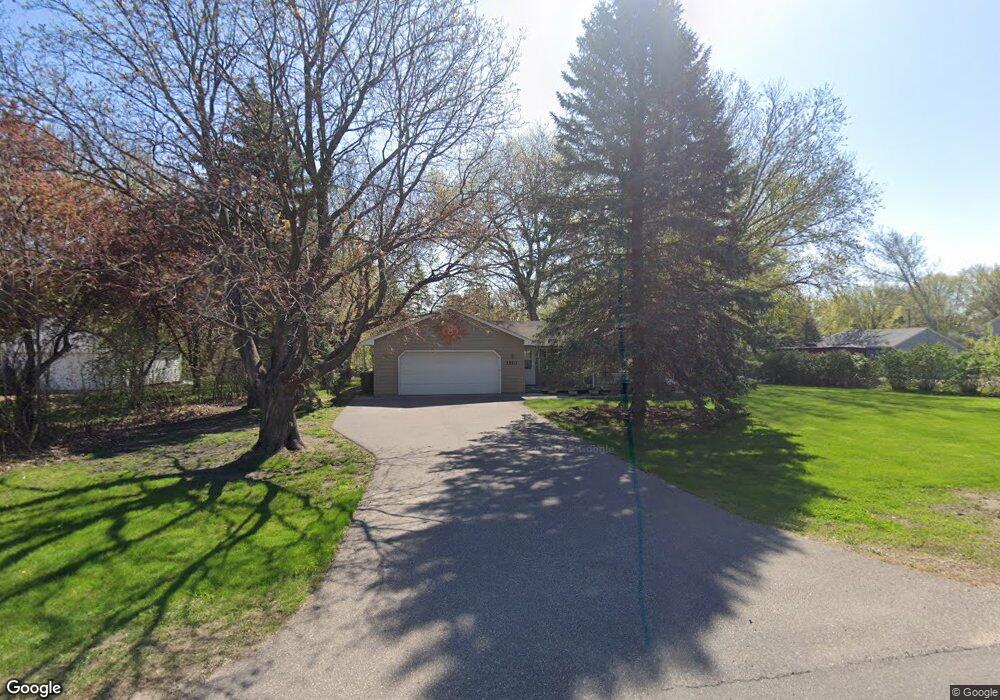
1520 Halgren Rd Maple Plain, MN 55359
Estimated Value: $277,000 - $306,000
3
Beds
2
Baths
1,156
Sq Ft
$251/Sq Ft
Est. Value
About This Home
This home is located at 1520 Halgren Rd, Maple Plain, MN 55359 and is currently estimated at $290,041, approximately $250 per square foot. 1520 Halgren Rd is a home located in Hennepin County with nearby schools including Schumann Elementary School, Orono Intermediate Elementary School, and Orono Middle School.
Ownership History
Date
Name
Owned For
Owner Type
Purchase Details
Closed on
Jun 19, 2015
Sold by
Sempf Paul G and Sempf Teri
Bought by
Sempf Paul G and Sempf Teri
Current Estimated Value
Home Financials for this Owner
Home Financials are based on the most recent Mortgage that was taken out on this home.
Original Mortgage
$129,000
Outstanding Balance
$100,163
Interest Rate
3.82%
Mortgage Type
New Conventional
Estimated Equity
$189,878
Purchase Details
Closed on
Jun 25, 2010
Sold by
Greene Jason M
Bought by
Sempf Paul G
Purchase Details
Closed on
Nov 17, 2003
Sold by
Greene Catherine G and Greene Gary L
Bought by
Greene Jason M and Greene Diana
Purchase Details
Closed on
Aug 12, 2003
Sold by
Rand Financial Services Inc
Bought by
Greene Catherine G and Greene Gary L
Purchase Details
Closed on
Oct 22, 2002
Sold by
Rootes Jason M and Rootes Vicky J
Bought by
Rand Financial Services Inc
Create a Home Valuation Report for This Property
The Home Valuation Report is an in-depth analysis detailing your home's value as well as a comparison with similar homes in the area
Home Values in the Area
Average Home Value in this Area
Purchase History
| Date | Buyer | Sale Price | Title Company |
|---|---|---|---|
| Sempf Paul G | -- | Titlesmart Inc | |
| Sempf Paul G | $141,000 | -- | |
| Greene Jason M | $187,500 | -- | |
| Greene Catherine G | $164,500 | -- | |
| Rand Financial Services Inc | $99,753 | -- |
Source: Public Records
Mortgage History
| Date | Status | Borrower | Loan Amount |
|---|---|---|---|
| Open | Sempf Paul G | $129,000 |
Source: Public Records
Tax History
| Year | Tax Paid | Tax Assessment Tax Assessment Total Assessment is a certain percentage of the fair market value that is determined by local assessors to be the total taxable value of land and additions on the property. | Land | Improvement |
|---|---|---|---|---|
| 2024 | $2,682 | $222,300 | $54,400 | $167,900 |
| 2023 | $2,564 | $223,500 | $58,400 | $165,100 |
| 2022 | $2,633 | $220,000 | $57,000 | $163,000 |
| 2021 | $2,319 | $199,000 | $57,000 | $142,000 |
| 2020 | $2,352 | $178,000 | $41,000 | $137,000 |
| 2019 | $2,399 | $172,000 | $40,000 | $132,000 |
| 2018 | $2,468 | $169,000 | $35,000 | $134,000 |
| 2017 | $2,606 | $168,000 | $55,000 | $113,000 |
| 2016 | $2,289 | $151,000 | $50,000 | $101,000 |
| 2015 | $2,157 | $142,000 | $46,000 | $96,000 |
| 2014 | -- | $133,000 | $50,000 | $83,000 |
Source: Public Records
Map
Nearby Homes
- 5508 Joyce St
- 1351 County Road 83
- 5540 Timber Trail
- 5340 Main St E
- 1635 Delano Ave
- 1487 Meadow Ln
- 5245 Clayton Dr
- 5183 Independence St
- 6201 Gustavus Dr
- 6126 Gustavus Dr
- 4819 Baker Reserve Ln
- 4842 Baker Reserve Ln
- 4801 Baker Reserve Ln
- 2017 Bridgevine Ct
- 2045 Bridgevine Ct
- 2101 Bridgevine Ct
- 2073 Bridgevine Ct
- 2084 Bridgevine Ct
- 4894 Bridgevine Way
- 4946 Bridgevine Way
- 1500 Halgren Rd
- 1540 Halgren Rd
- 1519 Wyman Ave
- 1495 Wyman Ave
- 1545 Wyman Ave
- 1519 Halgren Rd
- 1509 Halgren Rd
- 1539 Halgren Rd
- 1479 Wyman Ave
- 1475 Halgren Rd
- 1569 Halgren Rd
- 1460 Halgren Rd
- 1514 Rainbow Ave
- 1530 Rainbow Ave
- 1469 Halgren Rd
- 5550 Bryant St
- 1504 Rainbow Ave
- 1465 Wyman Ave
- 1540 Rainbow Ave
- 1490 Rainbow Ave
Your Personal Tour Guide
Ask me questions while you tour the home.