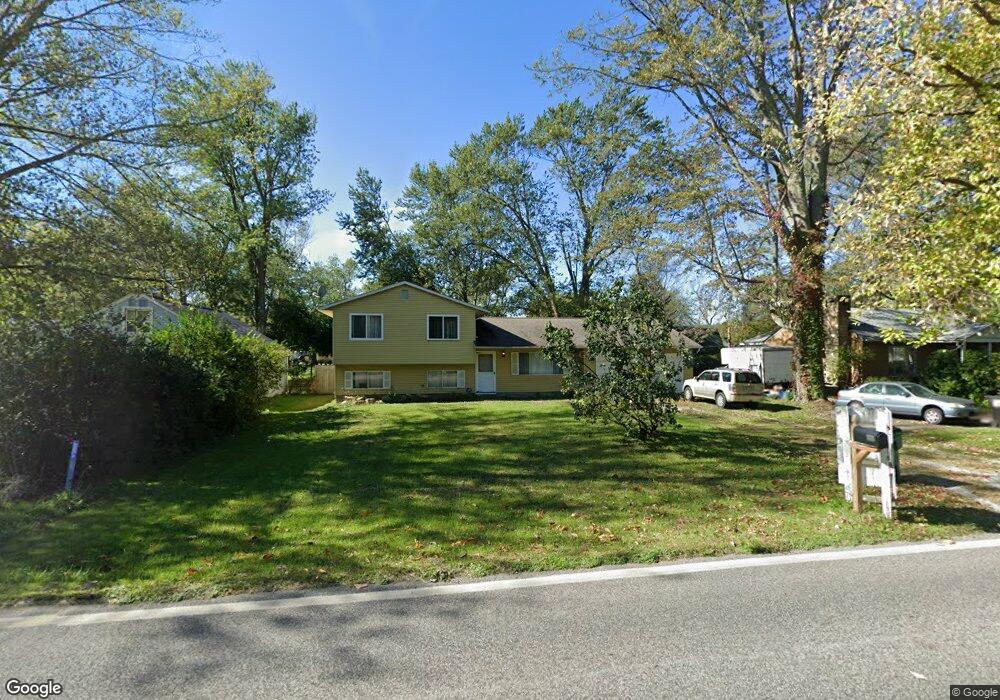
1520 Hubbard Rd Madison, OH 44057
Estimated Value: $194,000 - $220,000
3
Beds
2
Baths
1,868
Sq Ft
$110/Sq Ft
Est. Value
About This Home
This home is located at 1520 Hubbard Rd, Madison, OH 44057 and is currently estimated at $206,233, approximately $110 per square foot. 1520 Hubbard Rd is a home located in Lake County with nearby schools including North Elementary School, Madison Middle School, and Madison High School.
Ownership History
Date
Name
Owned For
Owner Type
Purchase Details
Closed on
Jul 23, 2021
Sold by
Schwartz Lauri A and Schwartz Louis A
Bought by
Schwartz Lauri A
Current Estimated Value
Home Financials for this Owner
Home Financials are based on the most recent Mortgage that was taken out on this home.
Original Mortgage
$10,989,000
Outstanding Balance
$9,999,515
Interest Rate
3.09%
Mortgage Type
FHA
Estimated Equity
-$9,793,282
Purchase Details
Closed on
Mar 21, 2003
Sold by
Charter One Credit Corp
Bought by
Mominey Ray W and Mominey Tanya M
Home Financials for this Owner
Home Financials are based on the most recent Mortgage that was taken out on this home.
Original Mortgage
$111,254
Interest Rate
5.96%
Mortgage Type
FHA
Purchase Details
Closed on
Sep 19, 2002
Sold by
Tabor Jerry Lee
Bought by
Charter One Credit Corp
Create a Home Valuation Report for This Property
The Home Valuation Report is an in-depth analysis detailing your home's value as well as a comparison with similar homes in the area
Home Values in the Area
Average Home Value in this Area
Purchase History
| Date | Buyer | Sale Price | Title Company |
|---|---|---|---|
| Schwartz Lauri A | -- | Timios Inc | |
| Mominey Ray W | $113,000 | -- | |
| Charter One Credit Corp | $90,000 | Real Estate Title |
Source: Public Records
Mortgage History
| Date | Status | Borrower | Loan Amount |
|---|---|---|---|
| Open | Schwartz Lauri A | $10,989,000 | |
| Closed | Mominey Ray W | $111,254 |
Source: Public Records
Tax History Compared to Growth
Tax History
| Year | Tax Paid | Tax Assessment Tax Assessment Total Assessment is a certain percentage of the fair market value that is determined by local assessors to be the total taxable value of land and additions on the property. | Land | Improvement |
|---|---|---|---|---|
| 2024 | -- | $61,220 | $7,620 | $53,600 |
| 2023 | $5,219 | $46,950 | $6,960 | $39,990 |
| 2022 | $3,462 | $46,950 | $6,960 | $39,990 |
| 2021 | $2,848 | $46,220 | $6,230 | $39,990 |
| 2020 | $2,736 | $39,180 | $5,290 | $33,890 |
| 2019 | $3,320 | $39,180 | $5,290 | $33,890 |
| 2018 | $2,538 | $34,880 | $5,290 | $29,590 |
| 2017 | $2,429 | $34,880 | $5,290 | $29,590 |
| 2016 | $2,205 | $34,880 | $5,290 | $29,590 |
| 2015 | $2,088 | $34,880 | $5,290 | $29,590 |
| 2014 | $2,135 | $34,880 | $5,290 | $29,590 |
| 2013 | $2,140 | $34,880 | $5,290 | $29,590 |
Source: Public Records
Map
Nearby Homes
- 1500 Easton Ave
- 6713 Dave Dr
- 1548 Rosena Ave
- V/L Magnolia #11 Dr
- 0 Indianola
- V/L Magnolia #23 Dr
- V/L Magnolia #21 Dr
- V/L Magnolia #20 Dr
- V/L Magnolia #18 Dr
- V/L Magnolia #19 Dr
- V/L Magnolia #17 Dr
- V/L Magnolia #16 Dr
- V/L Magnolia #15 Dr
- V/L Magnolia #14 Dr
- V/L Magnolia #13 Dr
- V/L Magnolia #12 Dr
- 1826 Hubbard Rd
- 1450 Davista Ave
- 6873 Lake Rd
- 1344 Davista Ave
- 1524 Hubbard Rd
- 1514 Hubbard Rd
- 1511 Park Ave
- 1517 Park Ave
- 1503 Park Ave
- 6653 Haywood Ave
- 1512 Hubbard Rd
- 1521 Hubbard Rd
- 1513 Hubbard Rd
- 1531 Hubbard Rd
- 6654 Haywood Ave
- 1499 Park Ave
- 1492 Hubbard Rd
- 1514 Park Ave
- 1518 Park Ave
- 1540 Hubbard Rd
- 1535 Hubbard Rd
- 1504 Park Ave
- 6651 Haywood Ave
- 1541 Park Ave