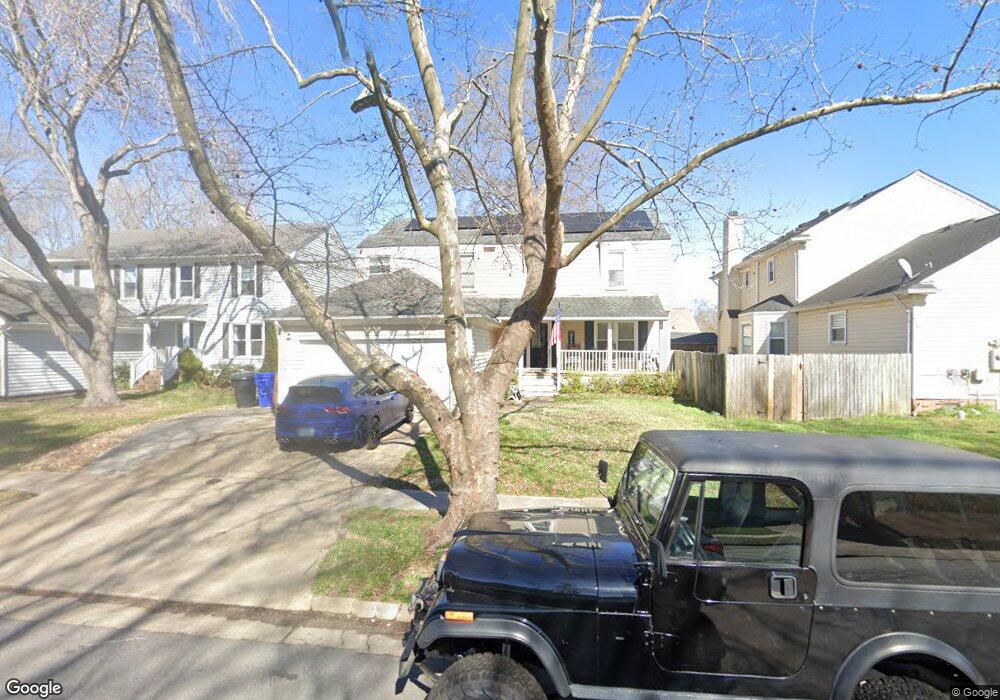
1520 Notley Dr Virginia Beach, VA 23456
Estimated Value: $472,319 - $507,000
4
Beds
3
Baths
2,097
Sq Ft
$234/Sq Ft
Est. Value
About This Home
This home is located at 1520 Notley Dr, Virginia Beach, VA 23456 and is currently estimated at $489,830, approximately $233 per square foot. 1520 Notley Dr is a home located in Virginia Beach City with nearby schools including Rosemont Forest Elementary School, Salem Middle School, and Salem High School.
Ownership History
Date
Name
Owned For
Owner Type
Purchase Details
Closed on
Aug 23, 2021
Sold by
Cobb William M and Cobb Kristin A
Bought by
Cobb William M
Current Estimated Value
Home Financials for this Owner
Home Financials are based on the most recent Mortgage that was taken out on this home.
Original Mortgage
$321,160
Outstanding Balance
$291,594
Interest Rate
2.8%
Mortgage Type
VA
Estimated Equity
$198,236
Purchase Details
Closed on
Nov 12, 2012
Sold by
Kittell Scott M and Kittell Rebecca
Bought by
Cobb William M
Home Financials for this Owner
Home Financials are based on the most recent Mortgage that was taken out on this home.
Original Mortgage
$291,127
Interest Rate
3.39%
Mortgage Type
VA
Purchase Details
Closed on
Dec 12, 2003
Sold by
Flowers Stephen M
Bought by
Kittell Scott M
Home Financials for this Owner
Home Financials are based on the most recent Mortgage that was taken out on this home.
Original Mortgage
$188,575
Interest Rate
5.9%
Mortgage Type
New Conventional
Create a Home Valuation Report for This Property
The Home Valuation Report is an in-depth analysis detailing your home's value as well as a comparison with similar homes in the area
Home Values in the Area
Average Home Value in this Area
Purchase History
| Date | Buyer | Sale Price | Title Company |
|---|---|---|---|
| Cobb William M | -- | Old Republic Title | |
| Cobb William M | $285,000 | -- | |
| Kittell Scott M | $198,500 | -- |
Source: Public Records
Mortgage History
| Date | Status | Borrower | Loan Amount |
|---|---|---|---|
| Open | Cobb William M | $321,160 | |
| Closed | Cobb William M | $291,127 | |
| Previous Owner | Kittell Scott M | $188,575 |
Source: Public Records
Tax History Compared to Growth
Tax History
| Year | Tax Paid | Tax Assessment Tax Assessment Total Assessment is a certain percentage of the fair market value that is determined by local assessors to be the total taxable value of land and additions on the property. | Land | Improvement |
|---|---|---|---|---|
| 2025 | -- | $411,300 | $165,000 | $246,300 |
| 2024 | $3,887 | $392,600 | $155,000 | $237,600 |
| 2023 | $3,793 | $383,100 | $147,200 | $235,900 |
| 2022 | $3,471 | $350,600 | $128,000 | $222,600 |
| 2021 | $3,034 | $306,500 | $116,000 | $190,500 |
| 2020 | $3,004 | $295,200 | $107,000 | $188,200 |
| 2019 | $2,954 | $277,300 | $103,000 | $174,300 |
| 2018 | $2,780 | $277,300 | $103,000 | $174,300 |
| 2017 | $2,727 | $272,000 | $101,000 | $171,000 |
| 2016 | $2,609 | $263,500 | $97,500 | $166,000 |
| 2015 | $2,603 | $262,900 | $106,300 | $156,600 |
| 2014 | $2,273 | $257,400 | $116,300 | $141,100 |
Source: Public Records
Map
Nearby Homes
- 1608 Notley Dr
- 1605 Ledge Hill Ct
- 1505 Hadley Ct
- 1613 Cliffwood Dr
- 1221 Hartford Dr
- 4706 Greenlaw Dr
- 1309 Elk Ct
- 4587 Greenlaw Dr
- 4456 Wilbraham Dr
- 1652 Castlefield Rd
- 1900 Haywards Heath
- 4700 Berrywood Ct
- 1912 Bunnell Ct
- 1121 Selwood Dr
- 1932 Grey Friars Chase
- 4612 Dorchester Ln
- 4684 Larkwood Dr
- 1339 Orillia Rd
- 1323 Hafford Rd
- 4357 Elderberry Ln
- 1516 Notley Dr
- 4528 Boxford Rd
- 1609 Shrewsbury Ct
- 1512 Notley Dr
- 1521 Notley Dr
- 1517 Notley Dr
- 1508 Notley Dr
- 4529 Boxford Rd
- 4601 Notley Ct
- 1601 Shrewsbury Ct
- 1601 Tewksbury Ct
- 1504 Notley Dr
- 4609 Notley Ct
- 1604 Notley Dr
- 4608 Boxford Rd
- 1601 Notley Dr
- 4520 Boxford Rd
- 1505 Notley Dr
- 1600 Shrewsbury Ct
- 1605 Tewksbury Ct