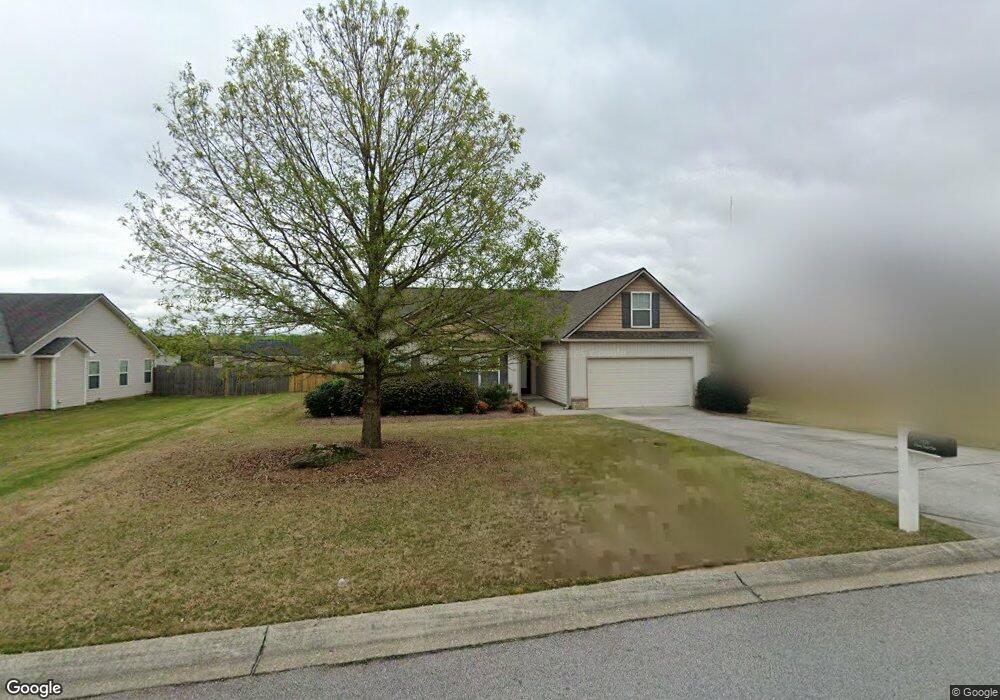
1520 Pointe South Cir Bethlehem, GA 30620
Estimated Value: $331,000 - $345,774
--
Bed
2
Baths
1,477
Sq Ft
$228/Sq Ft
Est. Value
About This Home
This home is located at 1520 Pointe South Cir, Bethlehem, GA 30620 and is currently estimated at $336,944, approximately $228 per square foot. 1520 Pointe South Cir is a home located in Barrow County with nearby schools including Yargo Elementary School, Haymon-Morris Middle School, and Apalachee High School.
Ownership History
Date
Name
Owned For
Owner Type
Purchase Details
Closed on
May 31, 2022
Sold by
Akin Gwyn Hope
Bought by
Turner Brittany and Turner Thomas
Current Estimated Value
Home Financials for this Owner
Home Financials are based on the most recent Mortgage that was taken out on this home.
Original Mortgage
$284,900
Outstanding Balance
$272,178
Interest Rate
5.75%
Mortgage Type
FHA
Estimated Equity
$64,766
Purchase Details
Closed on
Aug 31, 2016
Sold by
Phyllis D
Bought by
Smith Phyllis D and Akin Gwyn Hope
Home Financials for this Owner
Home Financials are based on the most recent Mortgage that was taken out on this home.
Original Mortgage
$140,830
Interest Rate
3.45%
Mortgage Type
New Conventional
Purchase Details
Closed on
Aug 19, 2009
Sold by
Castle Homes Pointe South Llc
Bought by
Smith Phyllis D
Home Financials for this Owner
Home Financials are based on the most recent Mortgage that was taken out on this home.
Original Mortgage
$156,244
Interest Rate
5.19%
Mortgage Type
New Conventional
Purchase Details
Closed on
Nov 21, 2005
Sold by
Gwd Inc
Bought by
Castle Homes Pointe South Llc
Purchase Details
Closed on
Aug 31, 2004
Bought by
Gwd Inc
Create a Home Valuation Report for This Property
The Home Valuation Report is an in-depth analysis detailing your home's value as well as a comparison with similar homes in the area
Home Values in the Area
Average Home Value in this Area
Purchase History
| Date | Buyer | Sale Price | Title Company |
|---|---|---|---|
| Turner Brittany | $330,000 | -- | |
| Smith Phyllis D | -- | -- | |
| Smith Phyllis D | $153,200 | -- | |
| Castle Homes Pointe South Llc | $3,948,000 | -- | |
| Gwd Inc | -- | -- |
Source: Public Records
Mortgage History
| Date | Status | Borrower | Loan Amount |
|---|---|---|---|
| Open | Turner Brittany | $284,900 | |
| Previous Owner | Smith Phyllis D | $140,830 | |
| Previous Owner | Smith Phyllis D | $156,244 |
Source: Public Records
Tax History Compared to Growth
Tax History
| Year | Tax Paid | Tax Assessment Tax Assessment Total Assessment is a certain percentage of the fair market value that is determined by local assessors to be the total taxable value of land and additions on the property. | Land | Improvement |
|---|---|---|---|---|
| 2024 | $3,009 | $119,489 | $26,800 | $92,689 |
| 2023 | $3,008 | $119,889 | $26,800 | $93,089 |
| 2022 | $2,502 | $88,458 | $24,000 | $64,458 |
| 2021 | $2,012 | $67,376 | $20,000 | $47,376 |
| 2020 | $2,013 | $67,376 | $20,000 | $47,376 |
| 2019 | $2,046 | $67,376 | $20,000 | $47,376 |
| 2018 | $1,686 | $56,306 | $13,200 | $43,106 |
| 2017 | $1,633 | $56,100 | $16,000 | $40,100 |
| 2016 | $1,358 | $46,655 | $16,000 | $30,655 |
| 2015 | $1,373 | $46,977 | $16,000 | $30,977 |
| 2014 | $1,175 | $40,118 | $8,820 | $31,298 |
| 2013 | -- | $37,811 | $8,820 | $28,991 |
Source: Public Records
Map
Nearby Homes
- 1758 Miller Springs Dr
- 117 Kensington Trace
- 50 Gillis Ln
- 524 Otway Loop
- 132 Galilee Ln
- 173 Hynes St
- 554 Otway Loop
- 222 Long Dr
- 102 Galilee Ln
- Lancaster Plan at The Estates at Casteel
- Buckley Plan at The Estates at Casteel
- Cardiff Plan at The Estates at Casteel
- Pearson Plan at The Estates at Casteel
- Savoy Plan at The Estates at Casteel
- Hampstead Plan at The Estates at Casteel
- Pembroke Plan at The Estates at Casteel
- 704 Newnham Walk
- Europa Plan at Casteel
- Astro Plan at Casteel
- Solstice Plan at Casteel
- 1520 Pointe Cir S
- 1520 Pointe Cir S Unit 2
- 1528 Pointe Cir S Unit 201
- 1528 Pointe Cir S
- 1518 Pointe South Cir
- 1528 Pointe South Cir
- 962 Compass Dr
- 960 Compass Dr
- 1514 Pointe Cir S
- 1514 Pointe South Cir
- 964 Compass Dr Unit 245
- 1519 Pointe Cir S
- 1521 Pointe Cir S
- 1521 Pointe South Cir
- 1523 Pointe South Cir
- 1519 Pointe South Cir
- 1529 Pointe Cir S
- 1512 Pointe South Cir
- 966 Compass Dr Unit 244