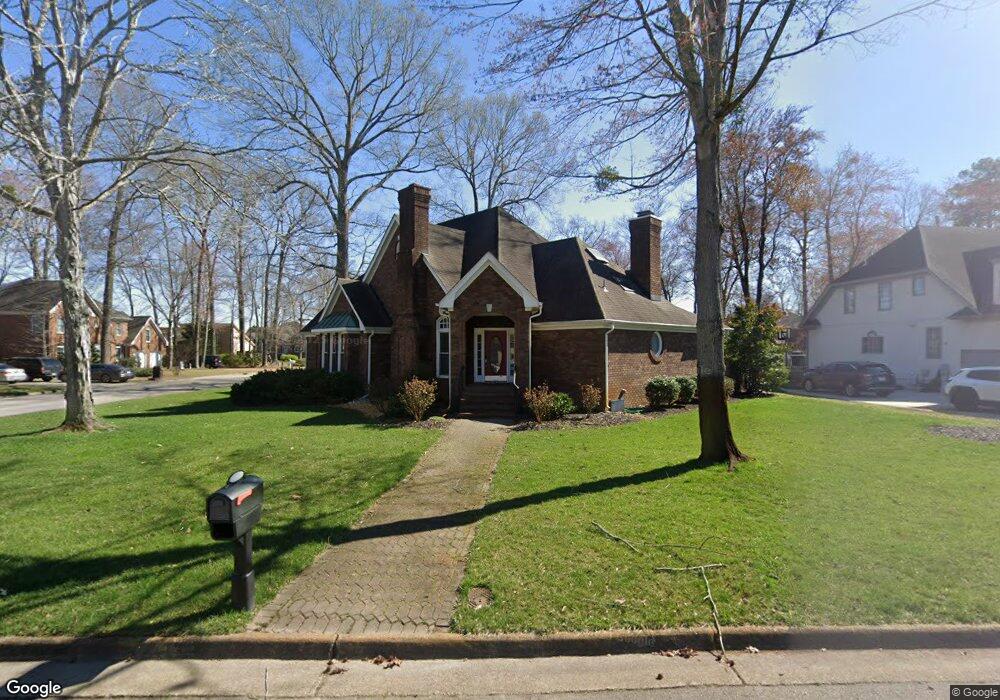
1520 Skyline Cir Chesapeake, VA 23320
Greenbrier East NeighborhoodEstimated Value: $624,769 - $651,000
4
Beds
3
Baths
2,954
Sq Ft
$217/Sq Ft
Est. Value
About This Home
This home is located at 1520 Skyline Cir, Chesapeake, VA 23320 and is currently estimated at $639,692, approximately $216 per square foot. 1520 Skyline Cir is a home located in Chesapeake City with nearby schools including Greenbrier Primary School, Greenbrier Intermediate School, and Greenbrier Middle.
Ownership History
Date
Name
Owned For
Owner Type
Purchase Details
Closed on
May 11, 2018
Sold by
Paramount Investments Llc A Virginia Lim
Bought by
Chipman Tobias A and Chipman Sylvia T
Current Estimated Value
Home Financials for this Owner
Home Financials are based on the most recent Mortgage that was taken out on this home.
Original Mortgage
$403,500
Outstanding Balance
$347,747
Interest Rate
4.44%
Mortgage Type
VA
Estimated Equity
$291,945
Purchase Details
Closed on
Mar 8, 2018
Sold by
Equity Trustees Llc A Virginia Limited L
Bought by
Paramount Investments Llc
Home Financials for this Owner
Home Financials are based on the most recent Mortgage that was taken out on this home.
Original Mortgage
$288,400
Interest Rate
4.38%
Mortgage Type
Commercial
Purchase Details
Closed on
Sep 26, 2006
Sold by
Sprinkle Mark A
Bought by
Aldridge Jon C
Home Financials for this Owner
Home Financials are based on the most recent Mortgage that was taken out on this home.
Original Mortgage
$350,000
Interest Rate
6.52%
Mortgage Type
New Conventional
Create a Home Valuation Report for This Property
The Home Valuation Report is an in-depth analysis detailing your home's value as well as a comparison with similar homes in the area
Home Values in the Area
Average Home Value in this Area
Purchase History
| Date | Buyer | Sale Price | Title Company |
|---|---|---|---|
| Chipman Tobias A | $430,000 | Landmark Title Llc | |
| Paramount Investments Llc | $320,000 | None Available | |
| Aldridge Jon C | $450,000 | -- |
Source: Public Records
Mortgage History
| Date | Status | Borrower | Loan Amount |
|---|---|---|---|
| Open | Chipman Tobias A | $403,500 | |
| Previous Owner | Paramount Investments Llc | $288,400 | |
| Previous Owner | Aldridge Jon C | $350,000 |
Source: Public Records
Tax History Compared to Growth
Tax History
| Year | Tax Paid | Tax Assessment Tax Assessment Total Assessment is a certain percentage of the fair market value that is determined by local assessors to be the total taxable value of land and additions on the property. | Land | Improvement |
|---|---|---|---|---|
| 2025 | $5,812 | $618,500 | $170,000 | $448,500 |
| 2024 | $5,812 | $575,400 | $160,000 | $415,400 |
| 2023 | $5,124 | $548,400 | $140,000 | $408,400 |
| 2022 | $5,203 | $515,100 | $135,000 | $380,100 |
| 2021 | $4,553 | $433,600 | $125,000 | $308,600 |
| 2020 | $4,381 | $417,200 | $120,000 | $297,200 |
| 2019 | $4,381 | $417,200 | $120,000 | $297,200 |
| 2018 | $4,161 | $400,800 | $110,000 | $290,800 |
| 2017 | $4,208 | $400,800 | $110,000 | $290,800 |
| 2016 | $4,156 | $395,800 | $105,000 | $290,800 |
| 2015 | $4,065 | $387,100 | $105,000 | $282,100 |
| 2014 | $3,778 | $359,800 | $105,000 | $254,800 |
Source: Public Records
Map
Nearby Homes
- 922 Biltmore Way
- 809 Mason Ct
- 1404 Sommerton Way
- 800 Monroe Ct
- 1000 Lil Walnut Ln
- 903 Cooper Ln
- 1419 Birch Leaf Rd
- 1423 Kemp Bridge Ln
- 1916 Shady Cove Ct
- 1304 Kemp Bridge Dr
- 1183 Killington Arch
- 1307 Plantation Lakes Cir
- 1821 Volvo Pkwy
- 813 Kemp Meadow Dr
- 661 Crestfield Dr
- 640 Crestfield Dr
- 1065 Messa Loop
- 1061 Messa Loop
- 1067 Messa Loop
- 1063 Messa Loop
- 1516 Skyline Cir
- 1255 Smokey Mountain Trail
- 1253 Smokey Mountain Trail
- 1521 Skyline Cir
- 1533 Shenandoah Pkwy
- 1512 Skyline Cir
- 1257 Smokey Mountain Trail
- 1517 Skyline Cir
- 1527 Shenandoah Pkwy
- 1251 Smokey Mountain Trail
- 1513 Skyline Cir
- 1508 Skyline Cir
- 1249 Smokey Mountain Trail
- 1248 Smokey Mountain Trail
- 1509 Skyline Cir
- 1523 Shenandoah Pkwy
- 1530 Shenandoah Pkwy
- 1528 Shenandoah Pkwy
- 1246 Smokey Mountain Trail
- 1504 Skyline Cir