1520 Spring Valley Cir Griffin, GA 30223
Spalding County NeighborhoodEstimated Value: $160,000 - $193,105
3
Beds
2
Baths
1,346
Sq Ft
$134/Sq Ft
Est. Value
About This Home
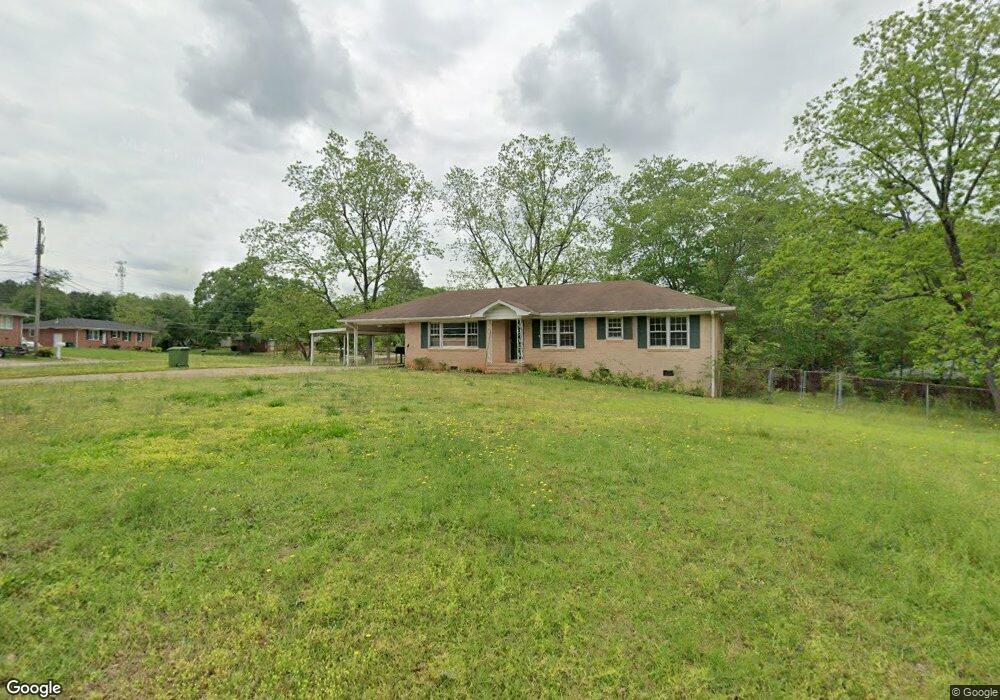
This home is located at 1520 Spring Valley Cir, Griffin, GA 30223 and is currently estimated at $180,776, approximately $134 per square foot. 1520 Spring Valley Cir is a home located in Spalding County with nearby schools including Orrs Elementary School, Carver Road Middle School, and Griffin High School.
Ownership History
Date
Name
Owned For
Owner Type
Purchase Details
Closed on
Nov 15, 2019
Sold by
Durden Thomas Roy
Bought by
Guzman Jose
Current Estimated Value
Purchase Details
Closed on
Nov 12, 2019
Sold by
Looney Cheryl Lavador
Bought by
Durden Thomas Roy
Purchase Details
Closed on
Oct 20, 2016
Sold by
Thompson Larry E and Thompson Kelly
Bought by
Durden Thomas Elijah
Home Financials for this Owner
Home Financials are based on the most recent Mortgage that was taken out on this home.
Original Mortgage
$63,822
Interest Rate
3.37%
Mortgage Type
FHA
Purchase Details
Closed on
Mar 24, 2016
Sold by
Acree Mary Jeanette
Bought by
Thompson Larry Edward and Thompson Kelly
Purchase Details
Closed on
Oct 7, 2000
Sold by
Thompson Lawrence J
Bought by
Acree Mary J
Purchase Details
Closed on
Mar 23, 1962
Bought by
Thompson Lawrence J and Minnie Belle
Create a Home Valuation Report for This Property
The Home Valuation Report is an in-depth analysis detailing your home's value as well as a comparison with similar homes in the area
Home Values in the Area
Average Home Value in this Area
Purchase History
| Date | Buyer | Sale Price | Title Company |
|---|---|---|---|
| Guzman Jose | $94,900 | -- | |
| Durden Thomas Roy | -- | -- | |
| Durden Thomas Roy | -- | -- | |
| Durden Thomas Elijah | $65,000 | -- | |
| Thompson Larry Edward | -- | -- | |
| Acree Mary J | -- | -- | |
| Thompson Lawrence J | $20,400 | -- |
Source: Public Records
Mortgage History
| Date | Status | Borrower | Loan Amount |
|---|---|---|---|
| Previous Owner | Durden Thomas Elijah | $63,822 |
Source: Public Records
Tax History Compared to Growth
Tax History
| Year | Tax Paid | Tax Assessment Tax Assessment Total Assessment is a certain percentage of the fair market value that is determined by local assessors to be the total taxable value of land and additions on the property. | Land | Improvement |
|---|---|---|---|---|
| 2024 | $2,608 | $68,302 | $9,620 | $58,682 |
| 2023 | $2,608 | $57,528 | $9,620 | $47,908 |
| 2022 | $1,963 | $49,126 | $8,320 | $40,806 |
| 2021 | $1,444 | $36,127 | $5,200 | $30,927 |
| 2020 | $1,444 | $36,127 | $5,200 | $30,927 |
| 2019 | $1,212 | $29,782 | $5,200 | $24,582 |
| 2018 | $1,157 | $27,392 | $5,200 | $22,192 |
| 2017 | $1,075 | $28,560 | $5,200 | $23,360 |
| 2016 | $1,100 | $28,560 | $5,200 | $23,360 |
| 2015 | $1,118 | $28,560 | $5,200 | $23,360 |
| 2014 | $1,151 | $28,560 | $5,200 | $23,360 |
Source: Public Records
Map
Nearby Homes
- 108 Mobley St
- 206 Elizabeth St
- 9 E Mcintosh Rd
- 1464 Beatty St
- 1807 Ridge St
- 10 E Mcintosh Rd
- 200,210 Highland Ave
- 101 Front St
- 1205 Chardonnay Ln
- 339 Main St
- 436 Lakeview St
- 1391 Experiment St Unit 12
- 1391 Experiment St
- 4038 W Mcintosh Rd
- 1652 Hallmark Hills Dr
- 1643 Hallmark Hills Dr
- 202 Cheatham St
- 221 Bleachery St
- 164 Crystal Brook
- 1406 N 9th St
- 1421 Upland Dr
- 1526 Spring Valley Cir
- 1806 Spring Valley Cir
- 1804 Spring Valley Cir
- 1808 Spring Valley Cir
- 1425 Upland Dr
- 1521 Spring Valley Cir
- 1523 Spring Valley Cir
- 1802 Spring Valley Cir
- 1810 Spring Valley Cir
- 1427 Upland Dr Unit 12
- 1427 Upland Dr
- 1525 Spring Valley Cir
- 1519 Spring Valley Cir
- 1527 Spring Valley Cir
- 1429 Upland Dr
- 1812 Spring Valley Cir
- 1517 Spring Valley Cir
- 1805 Old Atlanta Rd
- 1529 Spring Valley Cir