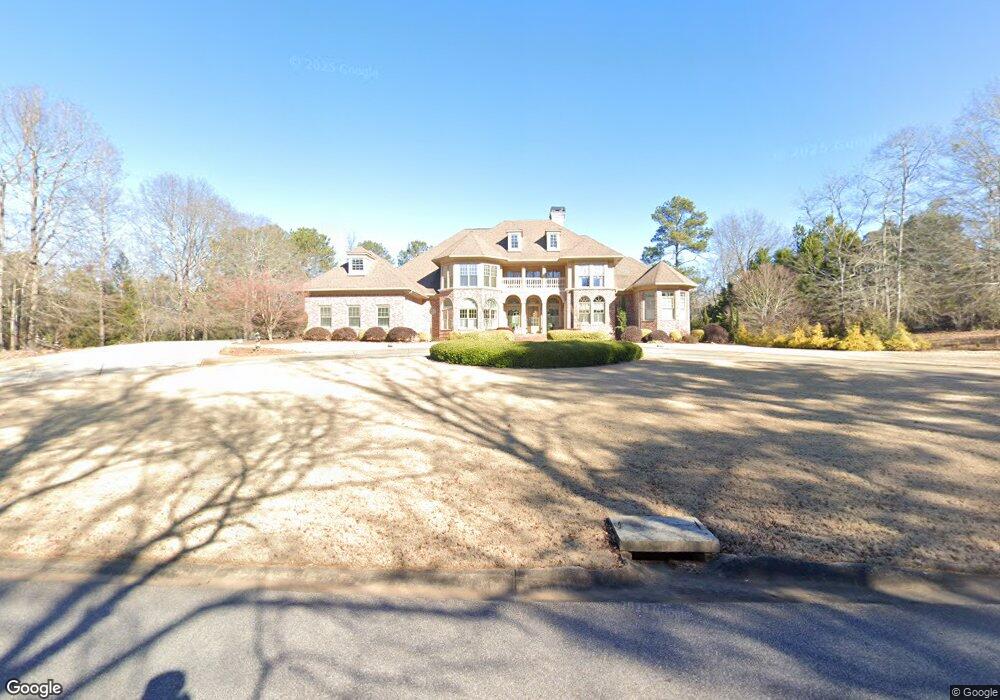
1520 Tanglebrook Dr Athens, GA 30606
Skyline NeighborhoodEstimated Value: $902,000 - $1,688,000
5
Beds
7
Baths
8,228
Sq Ft
$155/Sq Ft
Est. Value
About This Home
This home is located at 1520 Tanglebrook Dr, Athens, GA 30606 and is currently estimated at $1,275,219, approximately $154 per square foot. 1520 Tanglebrook Dr is a home located in Oconee County with nearby schools including Oconee County Primary School, Oconee County Elementary School, and Malcom Bridge Middle School.
Ownership History
Date
Name
Owned For
Owner Type
Purchase Details
Closed on
Jun 26, 2018
Sold by
Douglas
Bought by
Douglas Carol J
Current Estimated Value
Purchase Details
Closed on
Dec 12, 2003
Sold by
Victor Lemesis G and Victor Victor
Bought by
Douglas Dwight and Douglas Carol
Purchase Details
Closed on
Feb 9, 2000
Sold by
Thomas Pearline Y
Bought by
Lemesis Lemesis G and Lemesis Victor
Create a Home Valuation Report for This Property
The Home Valuation Report is an in-depth analysis detailing your home's value as well as a comparison with similar homes in the area
Home Values in the Area
Average Home Value in this Area
Purchase History
| Date | Buyer | Sale Price | Title Company |
|---|---|---|---|
| Douglas Carol J | -- | -- | |
| Douglas Dwight | $110,000 | -- | |
| Lemesis Lemesis G | $74,000 | -- |
Source: Public Records
Tax History Compared to Growth
Tax History
| Year | Tax Paid | Tax Assessment Tax Assessment Total Assessment is a certain percentage of the fair market value that is determined by local assessors to be the total taxable value of land and additions on the property. | Land | Improvement |
|---|---|---|---|---|
| 2024 | $6,167 | $477,725 | $46,800 | $430,925 |
| 2023 | $6,891 | $459,222 | $45,540 | $413,682 |
| 2022 | $7,873 | $417,775 | $45,540 | $372,235 |
| 2021 | $8,493 | $389,930 | $45,540 | $344,390 |
| 2020 | $8,530 | $388,684 | $45,540 | $343,144 |
| 2019 | $8,822 | $381,971 | $45,540 | $336,431 |
| 2018 | $8,635 | $361,919 | $45,540 | $316,379 |
| 2017 | $8,587 | $361,919 | $45,540 | $316,379 |
| 2016 | $8,412 | $354,501 | $45,540 | $308,961 |
| 2015 | $8,364 | $352,566 | $45,540 | $307,026 |
| 2014 | $7,648 | $315,706 | $45,540 | $270,166 |
| 2013 | -- | $337,433 | $50,600 | $286,833 |
Source: Public Records
Map
Nearby Homes
- 1480 Tanglebrook Dr
- 1540 Tanglebrook Dr
- 1450 Tanglebrook Dr
- 1541 Tanglebrook Dr
- 1511 Tanglebrook Dr
- 1440 Tanglebrook Dr
- 1561 Tanglebrook Dr
- 1560 Tanglebrook Dr
- 1491 Tanglebrook Dr
- 1471 Tanglebrook Dr
- 1591 Tanglebrook Dr
- 0 Gnarled Oak Ct
- 1020 Gnarled Oak Ct
- 1451 Tanglebrook Dr
- 1421 Tanglebrook Dr
- 1041 Laurel Place
- 1061 Laurel Place
- 1011 Laurel Place
- 1620 Tanglebrook Dr
- 1051 Pine Ridge Ct