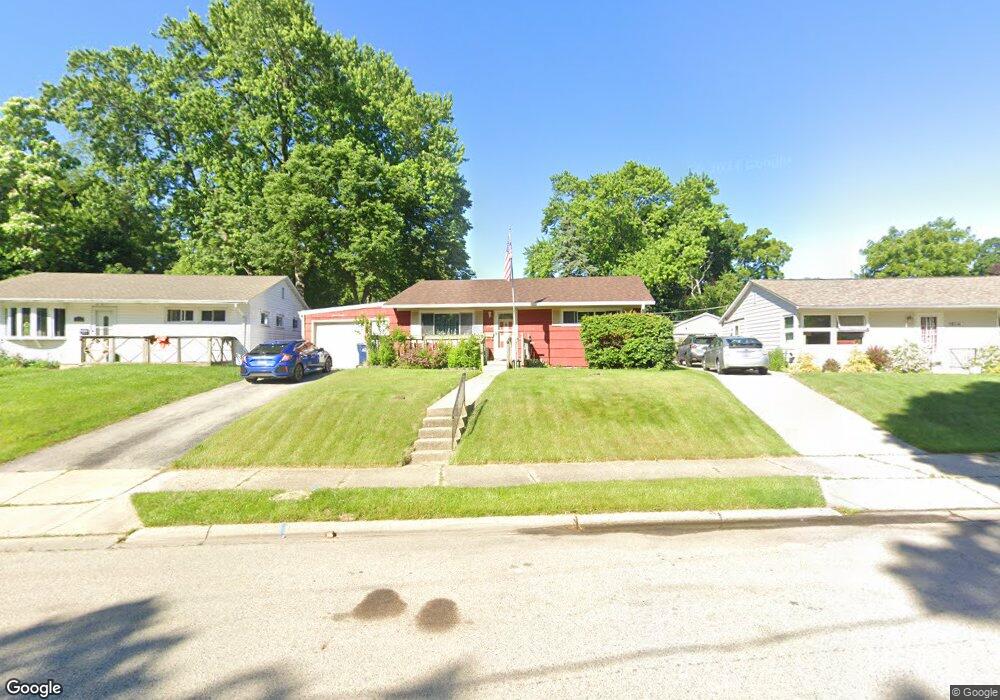
1520 Terrace Ave Waukegan, IL 60085
Estimated Value: $203,888 - $234,000
3
Beds
1
Bath
952
Sq Ft
$229/Sq Ft
Est. Value
About This Home
This home is located at 1520 Terrace Ave, Waukegan, IL 60085 and is currently estimated at $218,472, approximately $229 per square foot. 1520 Terrace Ave is a home located in Lake County with nearby schools including Greenwood Elementary School, Edith M Smith Middle School, and Waukegan High School.
Ownership History
Date
Name
Owned For
Owner Type
Purchase Details
Closed on
Jul 5, 2024
Sold by
Tasker Todd
Bought by
Tasker Jake and Tasker Cassandra
Current Estimated Value
Purchase Details
Closed on
Dec 11, 2014
Sold by
Tasker Carol and Tasker Michael J
Bought by
Tasker Carol S and Tasker Todd M
Purchase Details
Closed on
Feb 15, 2001
Sold by
Hud
Bought by
Tasker Jerome W
Purchase Details
Closed on
May 19, 2000
Sold by
Strowder Betty L and Ctx Mtg Company
Bought by
Hud
Purchase Details
Closed on
Mar 3, 1999
Sold by
Strowder Betty L and Strowder Peterson Betty L
Bought by
Peterson David and Strowder Peterson Betty L
Purchase Details
Closed on
Sep 25, 1997
Sold by
Vinegar Mark A and Vinegar Sharon M
Bought by
Strouder Betty L
Home Financials for this Owner
Home Financials are based on the most recent Mortgage that was taken out on this home.
Original Mortgage
$86,401
Interest Rate
7.54%
Mortgage Type
FHA
Create a Home Valuation Report for This Property
The Home Valuation Report is an in-depth analysis detailing your home's value as well as a comparison with similar homes in the area
Home Values in the Area
Average Home Value in this Area
Purchase History
| Date | Buyer | Sale Price | Title Company |
|---|---|---|---|
| Tasker Jake | -- | None Listed On Document | |
| Tasker Carol S | -- | None Available | |
| Tasker Jerome W | -- | Stewart Title Company | |
| Hud | -- | -- | |
| Peterson David | -- | -- | |
| Strouder Betty L | $58,000 | -- |
Source: Public Records
Mortgage History
| Date | Status | Borrower | Loan Amount |
|---|---|---|---|
| Previous Owner | Strouder Betty L | $86,401 |
Source: Public Records
Tax History Compared to Growth
Tax History
| Year | Tax Paid | Tax Assessment Tax Assessment Total Assessment is a certain percentage of the fair market value that is determined by local assessors to be the total taxable value of land and additions on the property. | Land | Improvement |
|---|---|---|---|---|
| 2024 | $4,326 | $51,704 | $10,823 | $40,881 |
| 2023 | $4,326 | $45,874 | $9,603 | $36,271 |
| 2022 | $3,690 | $37,749 | $7,949 | $29,800 |
| 2021 | $3,384 | $32,460 | $6,838 | $25,622 |
| 2020 | $3,428 | $30,240 | $6,370 | $23,870 |
| 2019 | $3,450 | $27,710 | $5,837 | $21,873 |
| 2018 | $3,431 | $26,540 | $8,261 | $18,279 |
| 2017 | $3,365 | $23,481 | $7,309 | $16,172 |
| 2016 | $3,153 | $20,404 | $6,351 | $14,053 |
| 2015 | $3,085 | $18,262 | $5,684 | $12,578 |
| 2014 | $3,254 | $19,232 | $5,061 | $14,171 |
| 2012 | $4,033 | $20,836 | $5,484 | $15,352 |
Source: Public Records
Map
Nearby Homes
- 1613 North Ave
- 616 W Keith Ave
- 1336 N Ash St
- 1335 Chestnut St
- 1110 N Ash St
- 415 W Ridgeland Ave
- 1018 W Atlantic Ave
- 2213 Alta Vista Dr
- 1905 Linden Ave
- 918 N Ash St
- 723 N County St
- 1312 N Linden Ave
- 2246 Alta Vista Dr
- 1105 Woodlawn Cir
- 325 4th St
- 611 N Genesee St
- 917 N Linden Ave
- 2232 Walnut St
- 620 N Poplar St
- 1000 Pine St
- 1524 Terrace Ave
- 1516 Terrace Ave
- 201 Harding Ave
- 1527 Terrace Ave
- 1523 Terrace Ave
- 205 Harding Ave
- 1512 Terrace Ave
- 123 Harding Ave
- 209 Harding Ave
- 1519 Terrace Ave
- 1509 N Sheridan Rd
- 200 Harding Ave
- 1515 N Sheridan Rd
- 213 Harding Ave
- 208 Harding Ave
- 128 Harding Ave
- 115 Harding Ave
- 1505 N Sheridan Rd
- 1515 Terrace Ave