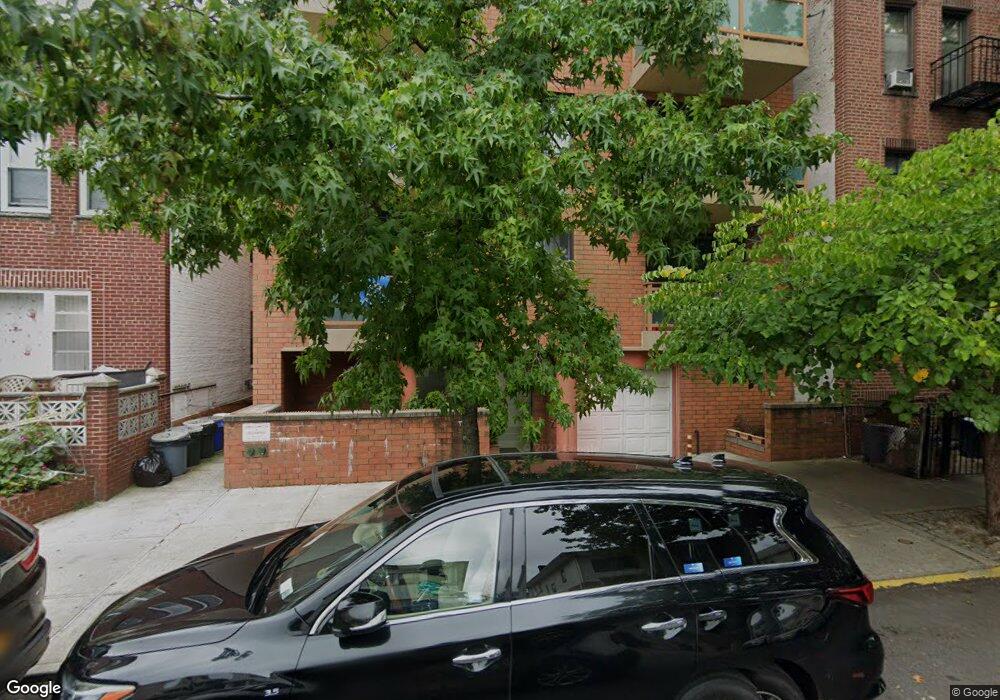
1520 W 10th St Unit 3B Brooklyn, NY 11204
Bensonhurst NeighborhoodEstimated Value: $642,000 - $690,938
--
Bed
--
Bath
884
Sq Ft
$744/Sq Ft
Est. Value
About This Home
This home is located at 1520 W 10th St Unit 3B, Brooklyn, NY 11204 and is currently estimated at $657,985, approximately $744 per square foot. 1520 W 10th St Unit 3B is a home located in Kings County with nearby schools including Seth Low Intermediate School 96, James Madison High School, and Success Academy Charter School - Bensonhurst.
Ownership History
Date
Name
Owned For
Owner Type
Purchase Details
Closed on
Aug 10, 2024
Sold by
Chan Sho Ying and Li Guo Jun
Bought by
Li Timmy and Li Tony
Current Estimated Value
Purchase Details
Closed on
Jan 31, 2023
Sold by
Fan Shueh and Lee-Fan Mei
Bought by
Chan Sho Ying and Li Guo Jun
Home Financials for this Owner
Home Financials are based on the most recent Mortgage that was taken out on this home.
Original Mortgage
$222,000
Outstanding Balance
$214,779
Interest Rate
6.13%
Mortgage Type
Purchase Money Mortgage
Estimated Equity
$443,206
Purchase Details
Closed on
Mar 29, 2010
Sold by
1520 West 10Th Street Llc
Bought by
Fan Shueh and Lee Mei
Home Financials for this Owner
Home Financials are based on the most recent Mortgage that was taken out on this home.
Original Mortgage
$320,000
Interest Rate
5.12%
Mortgage Type
Purchase Money Mortgage
Create a Home Valuation Report for This Property
The Home Valuation Report is an in-depth analysis detailing your home's value as well as a comparison with similar homes in the area
Home Values in the Area
Average Home Value in this Area
Purchase History
| Date | Buyer | Sale Price | Title Company |
|---|---|---|---|
| Li Timmy | -- | -- | |
| Chan Sho Ying | $622,000 | -- | |
| Chan Sho Ying | $622,000 | -- | |
| Fan Shueh | $402,800 | -- | |
| Fan Shueh | $402,800 | -- |
Source: Public Records
Mortgage History
| Date | Status | Borrower | Loan Amount |
|---|---|---|---|
| Open | Chan Sho Ying | $222,000 | |
| Closed | Chan Sho Ying | $222,000 | |
| Previous Owner | Fan Shueh | $320,000 |
Source: Public Records
Tax History Compared to Growth
Tax History
| Year | Tax Paid | Tax Assessment Tax Assessment Total Assessment is a certain percentage of the fair market value that is determined by local assessors to be the total taxable value of land and additions on the property. | Land | Improvement |
|---|---|---|---|---|
| 2025 | $7,874 | $111,969 | $15,840 | $96,129 |
| 2024 | $7,874 | $93,308 | $15,840 | $77,468 |
| 2023 | $5,403 | $91,724 | $15,840 | $75,884 |
| 2022 | $3,372 | $90,140 | $15,840 | $74,300 |
| 2021 | $1,639 | $82,319 | $15,840 | $66,479 |
| 2020 | $144 | $90,288 | $15,840 | $74,448 |
| 2019 | $145 | $84,526 | $15,840 | $68,686 |
| 2018 | $148 | $55,870 | $12,564 | $43,306 |
| 2017 | $148 | $51,732 | $12,317 | $39,415 |
| 2016 | $150 | $47,900 | $14,259 | $33,641 |
| 2015 | $117 | $44,352 | $15,840 | $28,512 |
| 2014 | $117 | $36,956 | $15,840 | $21,116 |
Source: Public Records
Map
Nearby Homes
- 1520 W 10th St Unit 2B
- 1520 W 10th St Unit 4A
- 1520 W 10th St Unit 2A
- 30 Avenue O
- 22 Avenue O
- 1521 W 10th St
- 1570 W 10th St Unit 1B
- 79 Avenue O Unit B2
- 157 Avenue P Unit 2A
- 1448 W 8th St
- 100 Avenue P Unit 1H
- 100 Avenue P Unit 4A
- 1436 W 8th St
- 1513 W 7th St Unit 1B
- 1569 W 7th St Unit 3B
- 1569 W 7th St Unit 1A
- 7416 Bay Pkwy
- 1392 W 7th St
- 2115 72nd St
- 1623 W 8th St
- 1520 W 10th St Unit 6A
- 1520 W 10th St Unit 5B
- 1520 W 10th St Unit 4B
- 1520 W 10th St Unit 3A
- 1528 W 10th St
- 1516 W 10th St Unit 1A
- 1516 W 10th St
- 1530 W 10th St
- 1514 W 10th St
- 1532 W 10th St
- 1525 W 11th St
- 1534 W 10th St
- 1534 W 10th St Unit 2
- 1534 W 10th St Unit 2R
- 1534 W 10th St Unit 2FL
- 1534 W 10th St Unit 1FL
- 1527 W 11th St
- 1531 W 11th St
- 26 Avenue O
- 32 Avenue O