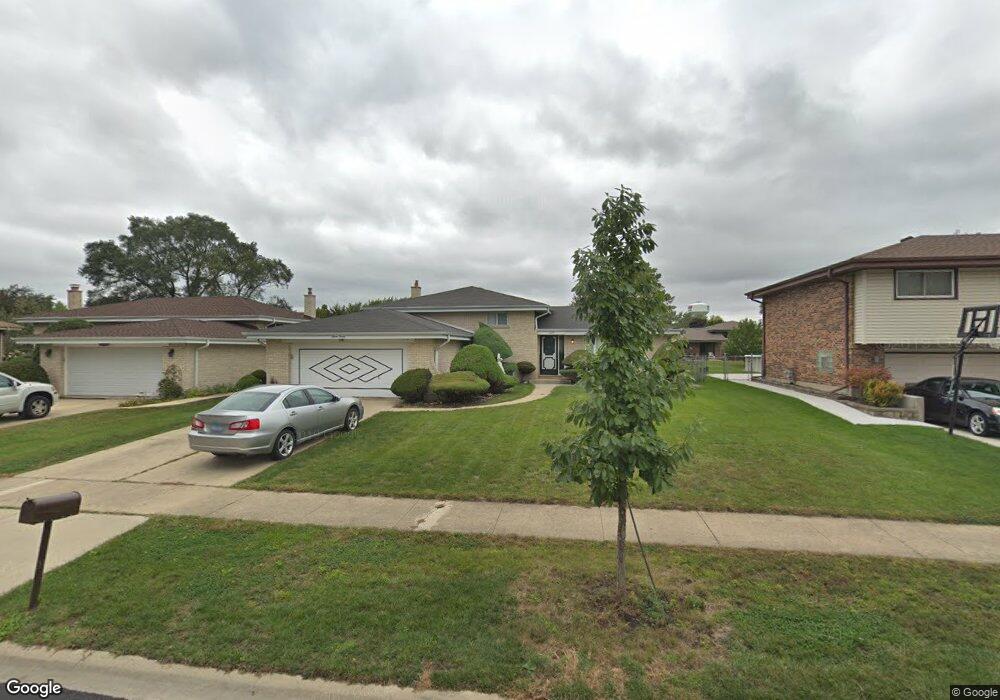
1520 W Amelia Ln Addison, IL 60101
Estimated Value: $360,250 - $444,000
Studio
1
Bath
2,217
Sq Ft
$186/Sq Ft
Est. Value
About This Home
This home is located at 1520 W Amelia Ln, Addison, IL 60101 and is currently estimated at $412,563, approximately $186 per square foot. 1520 W Amelia Ln is a home located in DuPage County with nearby schools including Stone Elementary School, Indian Trail Jr High School, and Addison Trail High School.
Ownership History
Date
Name
Owned For
Owner Type
Purchase Details
Closed on
Apr 30, 2021
Sold by
Chiappetta Elio
Bought by
West Suburban Bank
Current Estimated Value
Purchase Details
Closed on
Mar 26, 2021
Sold by
West Suburban Bank
Bought by
Chiappetta Elio
Purchase Details
Closed on
Oct 24, 2018
Sold by
Chiappetta Anna M and Chiappetta Elio
Bought by
West Suburban Bank and Trust Number 14387
Create a Home Valuation Report for This Property
The Home Valuation Report is an in-depth analysis detailing your home's value as well as a comparison with similar homes in the area
Home Values in the Area
Average Home Value in this Area
Purchase History
| Date | Buyer | Sale Price | Title Company |
|---|---|---|---|
| West Suburban Bank | -- | None Available | |
| Chiappetta Elio | -- | None Available | |
| West Suburban Bank | -- | None Available |
Source: Public Records
Tax History
| Year | Tax Paid | Tax Assessment Tax Assessment Total Assessment is a certain percentage of the fair market value that is determined by local assessors to be the total taxable value of land and additions on the property. | Land | Improvement |
|---|---|---|---|---|
| 2024 | $5,813 | $126,206 | $47,602 | $78,604 |
| 2023 | $6,071 | $116,020 | $43,760 | $72,260 |
| 2022 | $6,442 | $111,610 | $42,060 | $69,550 |
| 2021 | $6,460 | $106,910 | $40,290 | $66,620 |
| 2020 | $6,579 | $102,400 | $38,590 | $63,810 |
| 2019 | $6,811 | $98,470 | $37,110 | $61,360 |
| 2018 | $6,664 | $93,090 | $35,330 | $57,760 |
| 2017 | $6,472 | $88,970 | $33,770 | $55,200 |
| 2016 | $6,261 | $82,140 | $31,180 | $50,960 |
| 2015 | $6,065 | $75,880 | $28,800 | $47,080 |
| 2014 | $5,738 | $71,990 | $29,700 | $42,290 |
| 2013 | $5,633 | $73,460 | $30,310 | $43,150 |
Source: Public Records
Map
Nearby Homes
- 1651 W Goldengate Dr
- 551 N Plamondon Dr
- 1770 W Windmill Ct
- 1354 W Byron Ave Unit D
- 1306 W Byron Ave
- 1259 W Lake St Unit 203
- 19W720 Woodland Ave
- 4N212 8th Ave
- 823 N Harrow Ct
- 725 N 8th Ave
- 729 N 8th Ave
- 1113 N Itasca Rd
- 1210 N Foxdale Dr Unit 109
- 940 N Rohlwing Rd Unit 201A
- 3N662 Elizabeth St
- 1200 N Foxdale Dr Unit 205
- 1200 N Foxdale Dr Unit 100
- 4N327 7th Ave
- 953 N Rohlwing Rd Unit GB
- 1137 N Itasca Rd
- 1524 W Amelia Ln
- 1514 W Amelia Ln
- 1528 W Amelia Ln
- 1510 W Amelia Ln
- 1523 W Mulloy Dr
- 1519 W Mulloy Dr
- 1527 W Mulloy Dr
- 1515 W Amelia Ln
- 1511 W Mulloy Dr
- 1534 W Amelia Ln
- 1533 W Mulloy Dr
- 1504 W Amelia Ln
- 1521 W Amelia Ln
- 1509 W Amelia Ln
- 1533 W Amelia Ln
- 1509 W Mulloy Dr
- 1539 W Mulloy Dr
- 1538 W Amelia Ln
- 1539 W Amelia Ln
Your Personal Tour Guide
Ask me questions while you tour the home.