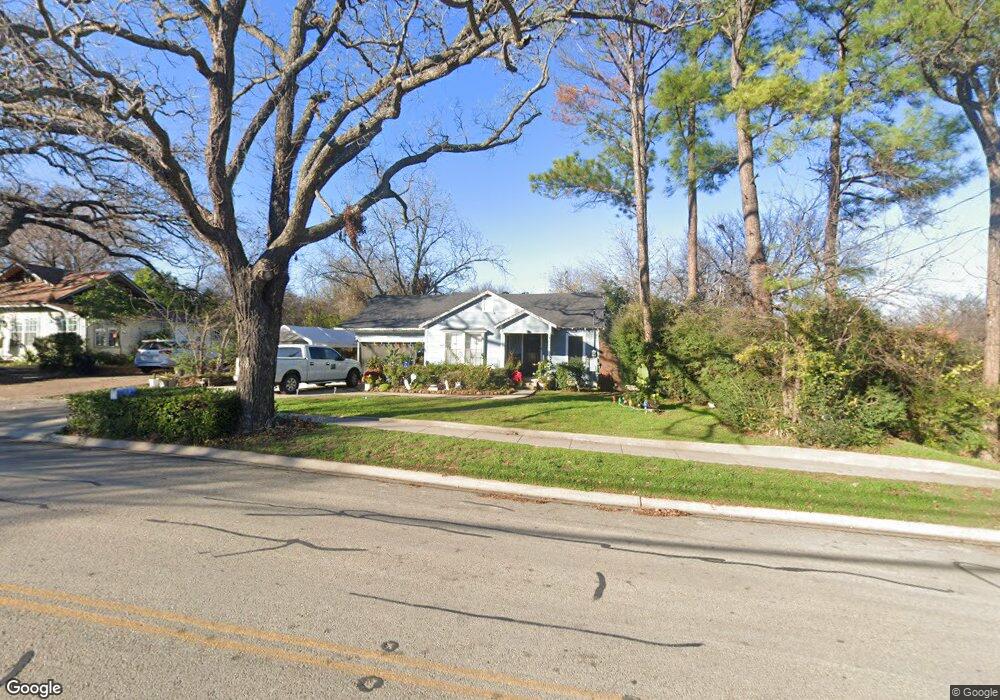
1520 Willowwood St Denton, TX 76205
Denia NeighborhoodEstimated Value: $360,000 - $382,762
4
Beds
3
Baths
2,020
Sq Ft
$184/Sq Ft
Est. Value
About This Home
This home is located at 1520 Willowwood St, Denton, TX 76205 and is currently estimated at $371,441, approximately $183 per square foot. 1520 Willowwood St is a home located in Denton County with nearby schools including Borman Elementary School, McMath Middle School, and Denton High School.
Ownership History
Date
Name
Owned For
Owner Type
Purchase Details
Closed on
Sep 25, 2020
Sold by
Lanlaur Llc
Bought by
Elizalde Joe M and Portugal Gustavo Nunez
Current Estimated Value
Home Financials for this Owner
Home Financials are based on the most recent Mortgage that was taken out on this home.
Original Mortgage
$228,043
Outstanding Balance
$202,832
Interest Rate
2.9%
Mortgage Type
New Conventional
Estimated Equity
$168,609
Purchase Details
Closed on
Sep 22, 2020
Sold by
Chamberlain Alan Ray
Bought by
Quest Homes Series Llc
Home Financials for this Owner
Home Financials are based on the most recent Mortgage that was taken out on this home.
Original Mortgage
$228,043
Outstanding Balance
$202,832
Interest Rate
2.9%
Mortgage Type
New Conventional
Estimated Equity
$168,609
Purchase Details
Closed on
Oct 3, 2008
Sold by
Chamberlain F Bruce and Chamberlain Marjorie
Bought by
Chamberlain Alan Ray
Create a Home Valuation Report for This Property
The Home Valuation Report is an in-depth analysis detailing your home's value as well as a comparison with similar homes in the area
Home Values in the Area
Average Home Value in this Area
Purchase History
| Date | Buyer | Sale Price | Title Company |
|---|---|---|---|
| Elizalde Joe M | -- | None Available | |
| Quest Homes Series Llc | -- | None Listed On Document | |
| Chamberlain Alan Ray | -- | None Available | |
| Chamberlain F Bruce | -- | None Available |
Source: Public Records
Mortgage History
| Date | Status | Borrower | Loan Amount |
|---|---|---|---|
| Open | Elizalde Joe M | $228,043 | |
| Closed | Quest Homes Series Llc | $189,600 |
Source: Public Records
Tax History Compared to Growth
Tax History
| Year | Tax Paid | Tax Assessment Tax Assessment Total Assessment is a certain percentage of the fair market value that is determined by local assessors to be the total taxable value of land and additions on the property. | Land | Improvement |
|---|---|---|---|---|
| 2025 | $7,901 | $379,491 | $126,072 | $253,419 |
| 2024 | $7,901 | $409,338 | $126,072 | $283,266 |
| 2023 | $7,075 | $370,521 | $126,072 | $244,449 |
| 2022 | $7,608 | $358,400 | $91,052 | $267,348 |
| 2021 | $4,830 | $217,281 | $49,028 | $168,253 |
| 2020 | $2,812 | $123,010 | $49,028 | $73,982 |
| 2019 | $3,011 | $126,199 | $49,028 | $77,171 |
| 2018 | $2,994 | $123,926 | $49,028 | $74,898 |
| 2017 | $2,912 | $117,792 | $49,028 | $69,580 |
| 2016 | $2,647 | $107,084 | $49,028 | $58,056 |
| 2015 | $903 | $98,764 | $49,028 | $49,736 |
| 2013 | -- | $91,217 | $49,028 | $42,189 |
Source: Public Records
Map
Nearby Homes
- 1619 Mccormick St
- 1523 Oakwood Dr
- 1618 Kendolph Dr
- 1211 Lindsey St
- 2216 Redwing Dr
- 2216 Ruff Rd
- 1211 Kendolph Dr
- PARROT Plan at Eagle Creek
- LARK Plan at Eagle Creek
- ROBIN Plan at Eagle Creek
- Texas Mockingbird Plan at Eagle Creek
- Kingbird Plan at Eagle Creek
- Plan 2824 at Eagle Creek
- MALLARD Plan at Eagle Creek
- Plan 2444 Modeled at Eagle Creek
- Plan 2501 at Eagle Creek
- SWAN Plan at Eagle Creek
- QUAIL Plan at Eagle Creek
- Plan 1581 at Eagle Creek
- OWL Plan at Eagle Creek
- 1516 Willowwood St
- 1512 Willowwood St
- 1508 Willowwood St
- 1514 Willowwood St
- 1517 Willowwood St
- 1500 Willowwood St
- 1515 Oakwood Dr
- 1511 Oakwood Dr
- 1519 Oakwood Dr
- 1507 Oakwood Dr
- 1414 Willowwood St
- 1503 Oakwood Dr
- 1419 Oakwood Dr
- 1415 Oakwood Dr
- 1812 Mccormick St
- 1816 Mccormick St
- 1808 Mccormick St
- 1411 Oakwood Dr
- 1802 Mccormick St
- 1712 Mccormick St