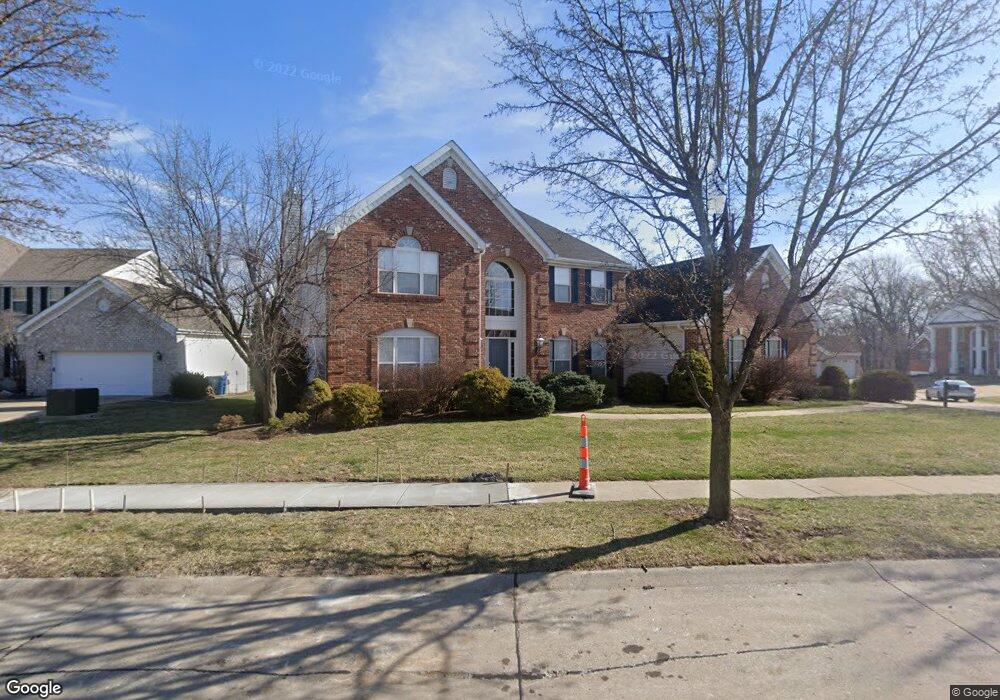
15209 Lamella Ct Chesterfield, MO 63017
Estimated Value: $712,000 - $783,000
4
Beds
3
Baths
3,317
Sq Ft
$227/Sq Ft
Est. Value
About This Home
This home is located at 15209 Lamella Ct, Chesterfield, MO 63017 and is currently estimated at $752,198, approximately $226 per square foot. 15209 Lamella Ct is a home located in St. Louis County with nearby schools including Shenandoah Valley Elementary, Parkway Central Middle School, and Parkway Central High School.
Ownership History
Date
Name
Owned For
Owner Type
Purchase Details
Closed on
Jul 8, 2008
Sold by
Quigley Sandra Shepley and Quigley Kevin
Bought by
The Betsy Breckenridge Revocable Trust
Current Estimated Value
Purchase Details
Closed on
Aug 9, 2002
Sold by
Quigley Sandra E Shepley and Quigley Kevin J
Bought by
Quigley Kevin J and Quigley Sandra Shepley
Purchase Details
Closed on
May 14, 2002
Sold by
Quigley Sandra Shepley and Quigley Kevin J
Bought by
Quigley Kevin J and Quigley Sandra Shepley
Purchase Details
Closed on
Jul 27, 2001
Sold by
Mcbride & Son Homes Inc
Bought by
Shepley Sandra E and Quigley Kevin J
Home Financials for this Owner
Home Financials are based on the most recent Mortgage that was taken out on this home.
Original Mortgage
$205,000
Interest Rate
7.07%
Create a Home Valuation Report for This Property
The Home Valuation Report is an in-depth analysis detailing your home's value as well as a comparison with similar homes in the area
Home Values in the Area
Average Home Value in this Area
Purchase History
| Date | Buyer | Sale Price | Title Company |
|---|---|---|---|
| The Betsy Breckenridge Revocable Trust | $555,000 | Title Partners Agency Llc | |
| Quigley Kevin J | $204,000 | -- | |
| Quigley Kevin J | -- | -- | |
| Shepley Sandra E | $380,321 | -- |
Source: Public Records
Mortgage History
| Date | Status | Borrower | Loan Amount |
|---|---|---|---|
| Previous Owner | Shepley Sandra E | $205,000 | |
| Closed | Quigley Kevin J | -- |
Source: Public Records
Tax History Compared to Growth
Tax History
| Year | Tax Paid | Tax Assessment Tax Assessment Total Assessment is a certain percentage of the fair market value that is determined by local assessors to be the total taxable value of land and additions on the property. | Land | Improvement |
|---|---|---|---|---|
| 2025 | $7,452 | $125,120 | $45,700 | $79,420 |
| 2024 | $7,452 | $112,830 | $21,930 | $90,900 |
| 2023 | $7,147 | $112,830 | $21,930 | $90,900 |
| 2022 | $6,593 | $94,700 | $21,930 | $72,770 |
| 2021 | $6,566 | $94,700 | $21,930 | $72,770 |
| 2020 | $6,449 | $89,320 | $21,930 | $67,390 |
| 2019 | $6,308 | $89,320 | $21,930 | $67,390 |
| 2018 | $6,643 | $87,250 | $21,930 | $65,320 |
| 2017 | $6,461 | $87,250 | $21,930 | $65,320 |
| 2016 | $6,316 | $81,040 | $15,430 | $65,610 |
| 2015 | $6,621 | $81,040 | $15,430 | $65,610 |
| 2014 | $5,846 | $76,480 | $27,210 | $49,270 |
Source: Public Records
Map
Nearby Homes
- 1110 Nooning Tree Dr
- 1123 Cabinview Ct
- 15324 Appalachian Trail
- 14560 White Birch Valley Ln
- 445 Whitestone Farm Dr
- 1237 Cedar Creek Rd
- 1226 Luray Dr
- 15509 Hitchcock Rd
- 14361 White Birch Valley Ln
- 15261 Springrun Dr
- 948 Grand Reserve Dr
- 39 White Plains Dr
- 14616 Rogue River Dr
- 224 Brayhill Ct
- 15000 S Outer 40 Rd
- 862 Wellesley Place Dr
- 240 Greentrails Dr S
- 384 Greentrails Dr S
- 162 New Holland Dr
- 214 Cordovan Commons Pkwy
- 1114 Nooning Tree Dr
- 15205 Lamella Ct
- 1117 Nooning Tree Dr
- 1126 Nooning Tree Dr
- 1121 Nooning Tree Dr
- 15201 Lamella Ct
- 1113 Nooning Tree Dr
- 15204 Lamella Ct
- 1125 Nooning Tree Dr
- 15200 Lamella Ct
- 1106 Nooning Tree Dr
- 1130 Nooning Tree Dr
- 1109 Nooning Tree Dr
- 1129 Nooning Tree Dr
- 1105 Nooning Tree Dr
- 1102 Nooning Tree Dr
- 1134 Nooning Tree Dr
- 1133 Nooning Tree Dr
- 1099 Nooning Tree Dr
- 1096 Nooning Tree Dr