Estimated Value: $131,000 - $148,000
2
Beds
2
Baths
1,004
Sq Ft
$139/Sq Ft
Est. Value
About This Home
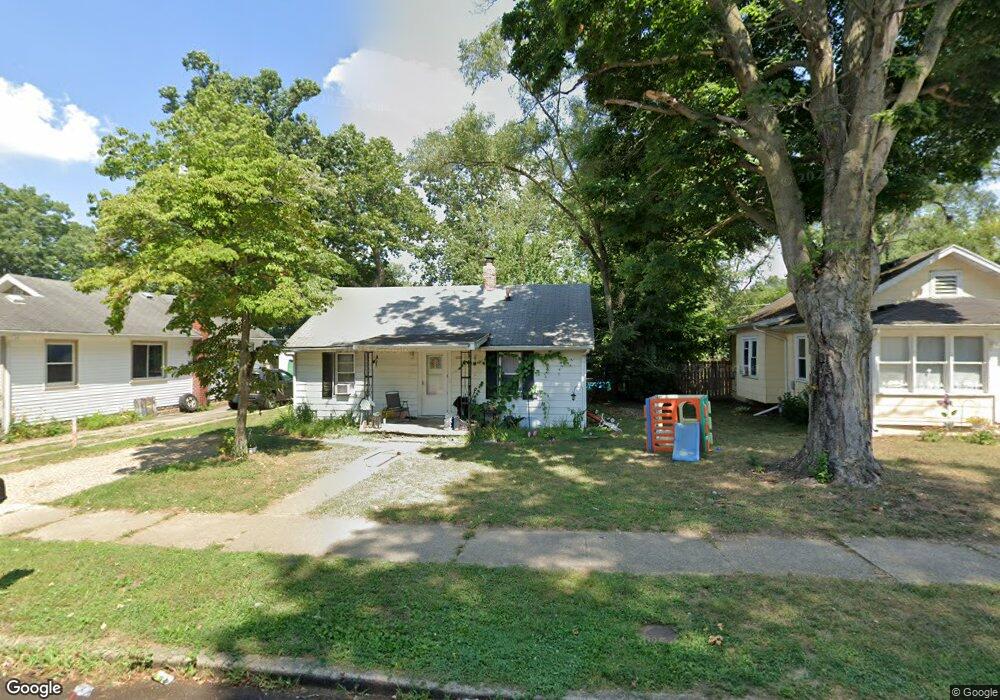
This home is located at 1521 Cherry St, Niles, MI 49120 and is currently estimated at $139,720, approximately $139 per square foot. 1521 Cherry St is a home located in Berrien County with nearby schools including James Ellis School, Howard-Ellis Elementary School, and Oak Manor Sixth Grade Center.
Ownership History
Date
Name
Owned For
Owner Type
Purchase Details
Closed on
Feb 21, 2017
Sold by
Moore Richard P and Moore Kathleen M
Bought by
Moore Richard P and Moore Kathleen M
Current Estimated Value
Purchase Details
Closed on
Oct 31, 2006
Sold by
Moore Dorothy E and Moore Richard P
Bought by
Moore Dorothy E and Moore Richard P
Purchase Details
Closed on
May 20, 1988
Purchase Details
Closed on
Aug 11, 1987
Purchase Details
Closed on
Jul 10, 1981
Purchase Details
Closed on
Mar 1, 1976
Purchase Details
Closed on
Feb 1, 1976
Create a Home Valuation Report for This Property
The Home Valuation Report is an in-depth analysis detailing your home's value as well as a comparison with similar homes in the area
Home Values in the Area
Average Home Value in this Area
Purchase History
| Date | Buyer | Sale Price | Title Company |
|---|---|---|---|
| Moore Richard P | -- | Attorney | |
| Moore Dorothy E | -- | None Available | |
| Moore Dorothy E | -- | None Available | |
| -- | $17,600 | -- | |
| -- | $16,900 | -- | |
| -- | -- | -- | |
| -- | $15,000 | -- | |
| -- | $8,000 | -- |
Source: Public Records
Tax History
| Year | Tax Paid | Tax Assessment Tax Assessment Total Assessment is a certain percentage of the fair market value that is determined by local assessors to be the total taxable value of land and additions on the property. | Land | Improvement |
|---|---|---|---|---|
| 2025 | $1,605 | $56,200 | $0 | $0 |
| 2024 | $846 | $51,800 | $0 | $0 |
| 2023 | $811 | $45,000 | $0 | $0 |
| 2022 | $773 | $41,900 | $0 | $0 |
| 2021 | $1,407 | $39,100 | $3,300 | $35,800 |
| 2020 | $1,391 | $30,000 | $0 | $0 |
| 2019 | $1,371 | $35,800 | $9,000 | $26,800 |
| 2018 | $1,321 | $35,800 | $0 | $0 |
| 2017 | $1,306 | $30,500 | $0 | $0 |
| 2016 | $1,284 | $26,600 | $0 | $0 |
| 2015 | $1,280 | $24,400 | $0 | $0 |
| 2014 | $671 | $24,300 | $0 | $0 |
Source: Public Records
Map
Nearby Homes
- 324 S 15th St
- 1451 Cedar St
- 1648 Oak St
- 1638 Superior St
- 0 S 15th St
- V/L S 15th St
- 1408 Silverbrook Ave
- 1008 Oak St
- 17 S 10th St
- 920 Cherry St
- 1314 Ferry St
- 2112 Kathryn Dr
- 319 S 5th St
- 2451 Spansail Dr
- 718 Regent St
- V/L Kathryn St Unit Tract 3
- 622 N 13th St
- 1316 Eagle St
- 400 Carefree Ct
- 0 Kathryn St Unit Tract 1
Your Personal Tour Guide
Ask me questions while you tour the home.