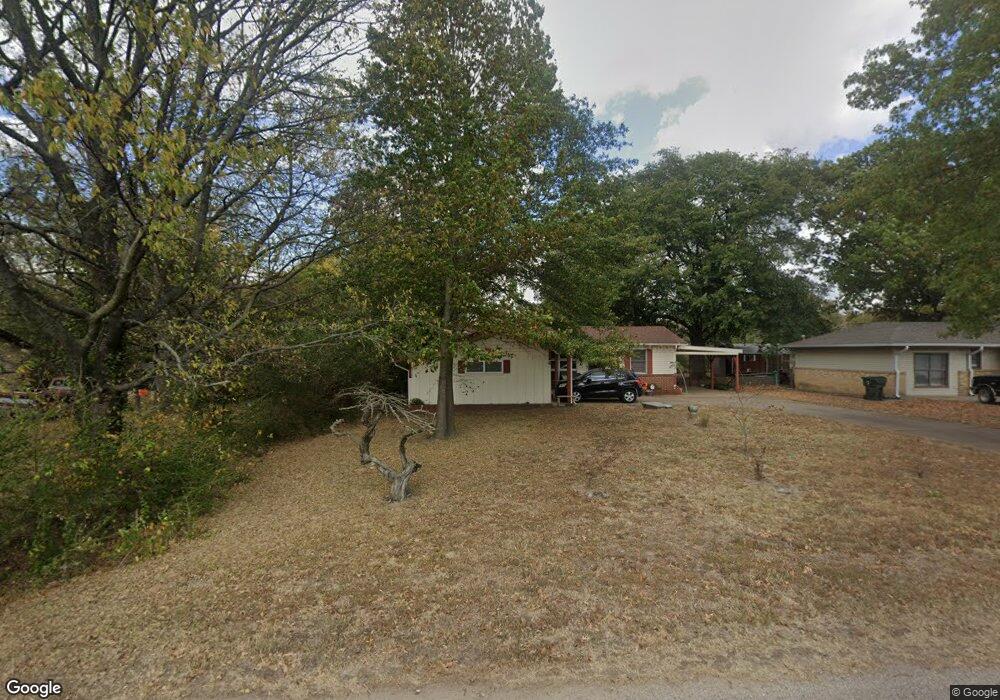
1521 E 10th St Okmulgee, OK 74447
Estimated Value: $96,000 - $132,000
3
Beds
2
Baths
1,326
Sq Ft
$89/Sq Ft
Est. Value
About This Home
This home is located at 1521 E 10th St, Okmulgee, OK 74447 and is currently estimated at $118,468, approximately $89 per square foot. 1521 E 10th St is a home located in Okmulgee County with nearby schools including Okmulgee Primary School, Dunbar Elementary School, and Okmulgee Middle School.
Ownership History
Date
Name
Owned For
Owner Type
Purchase Details
Closed on
Jun 5, 2024
Sold by
Jackson Kelly and Jackson James
Bought by
Robinson Jeana Kathryn
Current Estimated Value
Purchase Details
Closed on
Jan 21, 2022
Sold by
Jackson and Kelly
Bought by
Jackson James and Jackson Kelly
Home Financials for this Owner
Home Financials are based on the most recent Mortgage that was taken out on this home.
Original Mortgage
$68,000
Interest Rate
2.62%
Mortgage Type
New Conventional
Purchase Details
Closed on
Aug 27, 2019
Sold by
Goodwin Peter Newton and Goodwin Linda Gail
Bought by
Jackson James and Robinson Kelly
Home Financials for this Owner
Home Financials are based on the most recent Mortgage that was taken out on this home.
Original Mortgage
$40,000
Interest Rate
3.7%
Mortgage Type
New Conventional
Purchase Details
Closed on
Jun 16, 2005
Sold by
Mceirow James G and Mceirow Gilberetta
Bought by
Goodwin Peter Newton and Goodwin Linda Gail
Purchase Details
Closed on
Dec 29, 1997
Sold by
Adam Gary G
Bought by
Mcelroy James G and Mcelroy Shalee
Create a Home Valuation Report for This Property
The Home Valuation Report is an in-depth analysis detailing your home's value as well as a comparison with similar homes in the area
Home Values in the Area
Average Home Value in this Area
Purchase History
| Date | Buyer | Sale Price | Title Company |
|---|---|---|---|
| Robinson Jeana Kathryn | $95,000 | None Listed On Document | |
| Jackson James | -- | None Listed On Document | |
| Jackson James | $50,000 | Integrity Ttl & Closing Llc | |
| Goodwin Peter Newton | $48,000 | None Available | |
| Mcelroy James G | $36,000 | -- |
Source: Public Records
Mortgage History
| Date | Status | Borrower | Loan Amount |
|---|---|---|---|
| Previous Owner | Jackson James | $68,000 | |
| Previous Owner | Jackson James | $40,000 |
Source: Public Records
Tax History
| Year | Tax Paid | Tax Assessment Tax Assessment Total Assessment is a certain percentage of the fair market value that is determined by local assessors to be the total taxable value of land and additions on the property. | Land | Improvement |
|---|---|---|---|---|
| 2025 | $1,045 | $11,400 | $540 | $10,860 |
| 2024 | $569 | $6,285 | $540 | $5,745 |
| 2023 | $673 | $7,903 | $540 | $7,363 |
| 2022 | $668 | $7,903 | $540 | $7,363 |
| 2021 | $699 | $7,903 | $540 | $7,363 |
| 2020 | $699 | $7,905 | $540 | $7,365 |
| 2019 | $677 | $7,670 | $540 | $7,130 |
| 2018 | $654 | $7,305 | $540 | $6,765 |
| 2017 | $616 | $6,957 | $540 | $6,417 |
| 2016 | $588 | $6,626 | $540 | $6,086 |
| 2015 | $543 | $6,310 | $540 | $5,770 |
| 2014 | $521 | $6,010 | $540 | $5,470 |
Source: Public Records
Map
Nearby Homes
Your Personal Tour Guide
Ask me questions while you tour the home.