S
Seller's Agent in 2025
Stephen DiJulius
St. Joseph Realty Group
(574) 250-0893
4 in this area
163 Total Sales
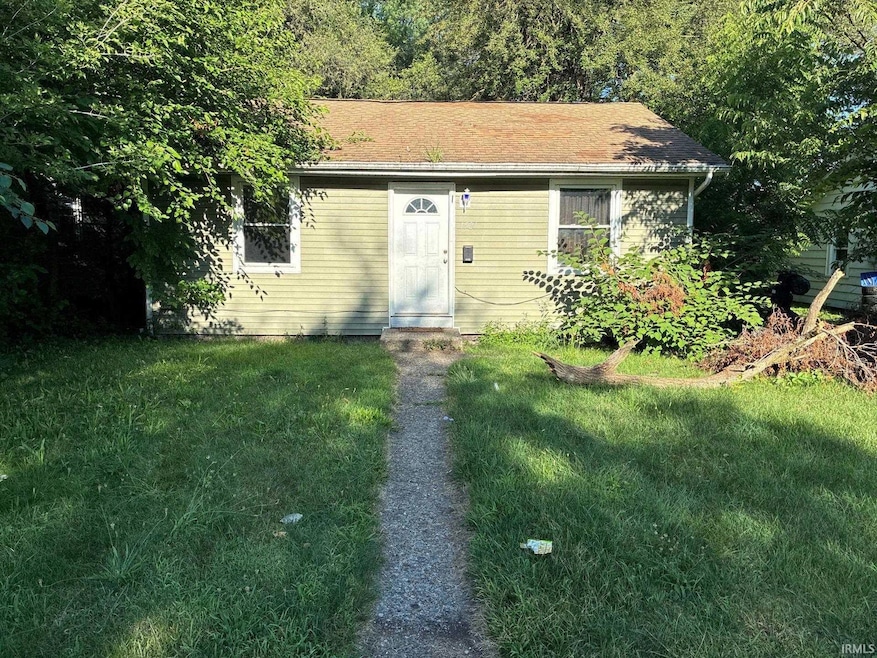
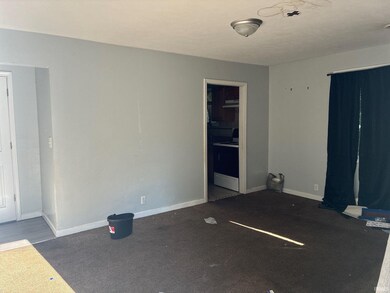
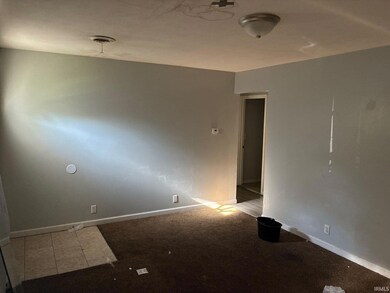
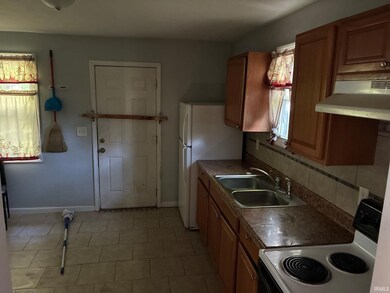
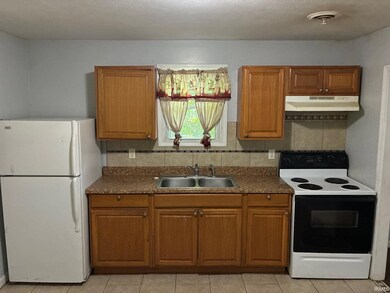
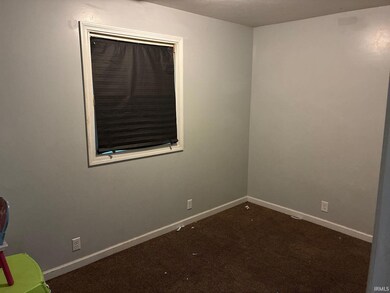
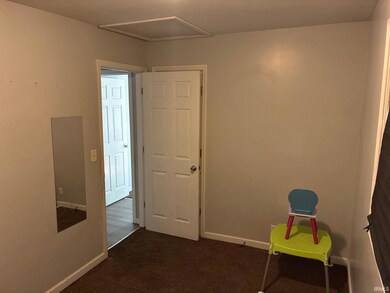
Investor special! 2 bed, 1 bath home that’s vacant and ready for rehab. A solid opportunity for investors looking to flip or add to their rental portfolio in a strong rental area. Can be purchased individually or as part of an 8-property portfolio including 1038 Huey St, 2106 Bertrand St, 1234 McCartney St, 1525 Fremont St, 1508 Fellows St, 1521 Fremont St, 1361 Huey St, and 1501 Johnson St. Ask about full package pricing and details.
| Date | Type | Sale Price | Title Company |
|---|---|---|---|
| Warranty Deed | -- | None Listed On Document | |
| Warranty Deed | -- | None Listed On Document | |
| Quit Claim Deed | -- | -- | |
| Quit Claim Deed | -- | -- | |
| Quit Claim Deed | -- | -- | |
| Sheriffs Deed | -- | -- | |
| Quit Claim Deed | -- | None Available | |
| Sheriffs Deed | -- | -- | |
| Warranty Deed | -- | None Available |
| Date | Status | Loan Amount | Loan Type |
|---|---|---|---|
| Previous Owner | $53,100 | New Conventional |
| Date | Event | Price | Change | Sq Ft Price |
|---|---|---|---|---|
| 08/08/2025 08/08/25 | Sold | $55,000 | 0.0% | $82 / Sq Ft |
| 07/14/2025 07/14/25 | Pending | -- | -- | -- |
| 07/14/2025 07/14/25 | For Sale | $55,000 | -- | $82 / Sq Ft |
| Year | Tax Paid | Tax Assessment Tax Assessment Total Assessment is a certain percentage of the fair market value that is determined by local assessors to be the total taxable value of land and additions on the property. | Land | Improvement |
|---|---|---|---|---|
| 2024 | $937 | $35,600 | $6,200 | $29,400 |
| 2023 | $894 | $37,500 | $6,300 | $31,200 |
| 2022 | $900 | $37,500 | $6,300 | $31,200 |
| 2021 | $749 | $29,400 | $800 | $28,600 |
| 2020 | $749 | $29,400 | $800 | $28,600 |
| 2019 | $631 | $29,400 | $800 | $28,600 |
| 2018 | $745 | $29,400 | $800 | $28,600 |
| 2017 | $772 | $29,300 | $800 | $28,500 |
| 2016 | $788 | $29,300 | $800 | $28,500 |
| 2014 | $755 | $28,900 | $800 | $28,100 |
| 2013 | $786 | $30,000 | $800 | $29,200 |
S
Seller's Agent in 2025
Stephen DiJulius
St. Joseph Realty Group
(574) 250-0893
4 in this area
163 Total Sales
Source: Indiana Regional MLS
MLS Number: 202527231
APN: 71-03-34-379-017.000-026
Disclaimer: Certain information contained herein is derived from information provided by parties other than Homes.com. All information provided is deemed reliable, but is not guaranteed to be accurate and should be independently verified.
![]() IDX information is provided exclusively for personal, non-commercial use, and may not be used for any purpose other than to identify prospective properties consumers may be interested in purchasing. Information is deemed reliable but not guaranteed.
IDX information is provided exclusively for personal, non-commercial use, and may not be used for any purpose other than to identify prospective properties consumers may be interested in purchasing. Information is deemed reliable but not guaranteed.
