
1521 Hunt Rd Cincinnati, OH 45215
Estimated payment $0/month
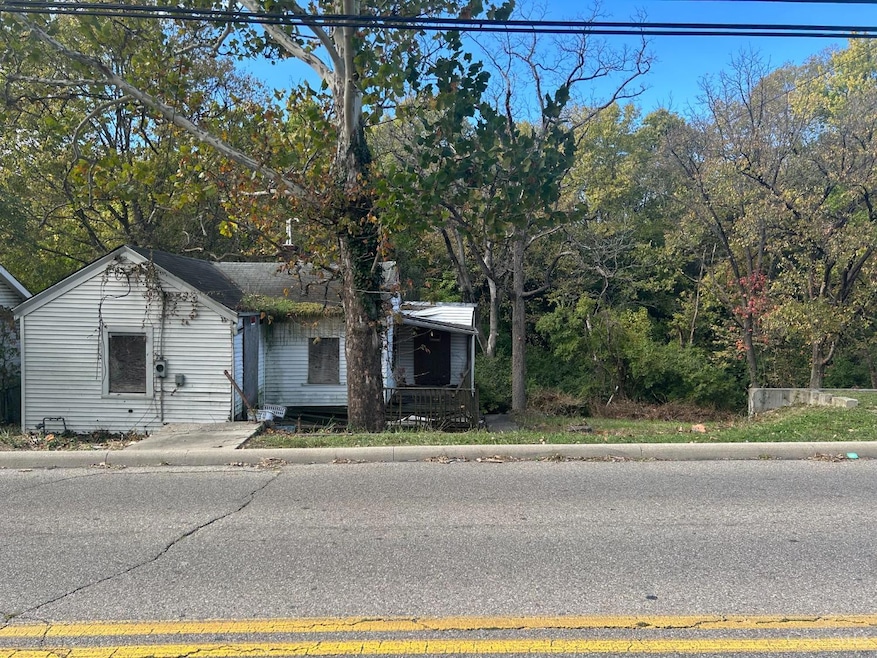
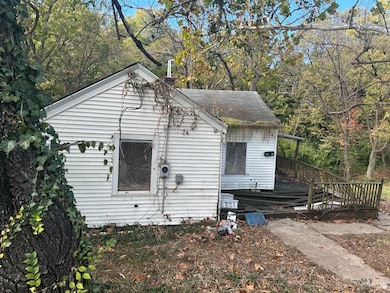
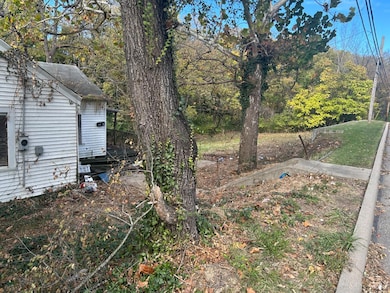
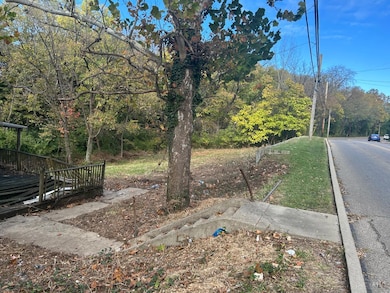
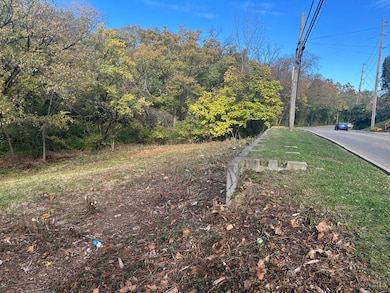
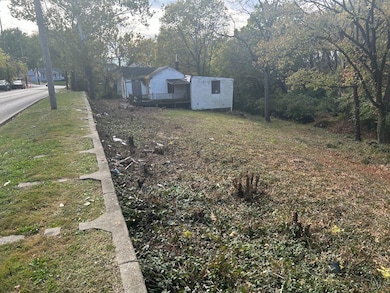
About This Lot
Exceptional Development Opportunity in Reading! Don't miss your chance to own three adjoining parcels totaling 0.692 acres along Hunt Rd. Easy access to I-75 and Ronald Reagan HWY. Each parcel can be purchased individually or together for a larger project. One parcel currently includes a structure in poor condition that will need removal-an ideal blank canvas for redevelopment. Priced individually: 671-0003-0082-00 ---- $75,000 671-0003-0110-00 ---- $65,000 671-0003-0112-00 ---- 45,0000 Or package deal $185,000
Listing Agent
3CRE Residential Advisors, LLC License #2021008488 Listed on: 10/26/2025
Property Details
Property Type
- Land
Est. Annual Taxes
- $739
Additional Features
- Partially Wooded Lot
- Gas Available at Street
Community Details
- No Home Owners Association
Map
Home Values in the Area
Average Home Value in this Area
Tax History
| Year | Tax Paid | Tax Assessment Tax Assessment Total Assessment is a certain percentage of the fair market value that is determined by local assessors to be the total taxable value of land and additions on the property. | Land | Improvement |
|---|---|---|---|---|
| 2024 | $739 | $13,615 | $8,281 | $5,334 |
| 2023 | $738 | $13,615 | $8,281 | $5,334 |
| 2022 | $880 | $12,604 | $3,329 | $9,275 |
| 2021 | $903 | $12,604 | $3,329 | $9,275 |
| 2020 | $743 | $12,604 | $3,329 | $9,275 |
| 2019 | $723 | $11,155 | $2,947 | $8,208 |
| 2018 | $724 | $11,155 | $2,947 | $8,208 |
| 2017 | $691 | $11,155 | $2,947 | $8,208 |
| 2016 | $103 | $1,751 | $1,474 | $277 |
| 2015 | $104 | $1,751 | $1,474 | $277 |
| 2014 | $668 | $12,838 | $3,122 | $9,716 |
| 2013 | $677 | $13,101 | $3,185 | $9,916 |
Property History
| Date | Event | Price | List to Sale | Price per Sq Ft |
|---|---|---|---|---|
| 10/26/2025 10/26/25 | For Sale | $1 | -100.0% | -- |
| 08/25/2025 08/25/25 | For Sale | $120,000 | -- | -- |
Purchase History
| Date | Type | Sale Price | Title Company |
|---|---|---|---|
| Limited Warranty Deed | -- | None Available | |
| Deed | $10,350 | -- | |
| Warranty Deed | $5,000 | Attorney | |
| Deed | $12,800 | -- |
Mortgage History
| Date | Status | Loan Amount | Loan Type |
|---|---|---|---|
| Previous Owner | -- | No Value Available | |
| Previous Owner | $12,500 | No Value Available |
Source: MLS of Greater Cincinnati (CincyMLS)
MLS Number: 1859872
APN: 671-0003-0082
Disclaimer: Certain information contained herein is derived from information provided by parties other than Homes.com. All information provided is deemed reliable, but is not guaranteed to be accurate and should be independently verified.
![]() The data relating to real estate for sale on this website comes in part from the Broker Reciprocity programs of the MLS of Greater Cincinnati, Inc.. Those listings held by brokerage firms other than Ten-X are marked with the Broker Reciprocity logo and house icon. The properties displayed may not be all of the properties available through Broker Reciprocity.
The data relating to real estate for sale on this website comes in part from the Broker Reciprocity programs of the MLS of Greater Cincinnati, Inc.. Those listings held by brokerage firms other than Ten-X are marked with the Broker Reciprocity logo and house icon. The properties displayed may not be all of the properties available through Broker Reciprocity.
IDX information is provided exclusively for personal, non-commercial use, and may not be used for any purpose other than to identify prospective properties consumers may be interested in purchasing.
Information is deemed reliable but not guaranteed.
Ten-X does not display the entire Cincinnati MLS Broker Reciprocity™ database on this web site. The listings of some real estate brokerage firms have been excluded.
Copyright 2025, MLS of Greater Cincinnati, Inc. All rights reserved
- 85 Aljoy Ct
- 1719 Hunt Rd
- 64 Gahl Terrace
- 40 S Terrace Dr
- 200 W Mechanic St Unit 200 w mechanic
- 228 Pike St Unit ID1014424P
- 228 Pike St Unit ID1036068P
- 228 Pike St Unit ID1036067P
- 228 Pike St Unit ID1014457P
- 228 Pike St Unit ID1014428P
- 145 W Benson St Unit 1
- 300-400 Hillside Ave
- 1 E Lake Shore Dr
- 247 Ohio Ave Unit 247
- 405 Mcewing Dr
- 516 Olden Ave Unit 1
- 512 Olden Ave Unit 2
- 631 Mulberry St
- 3803 Fox Run Dr
- 500 W Wyoming Ave Unit 1
