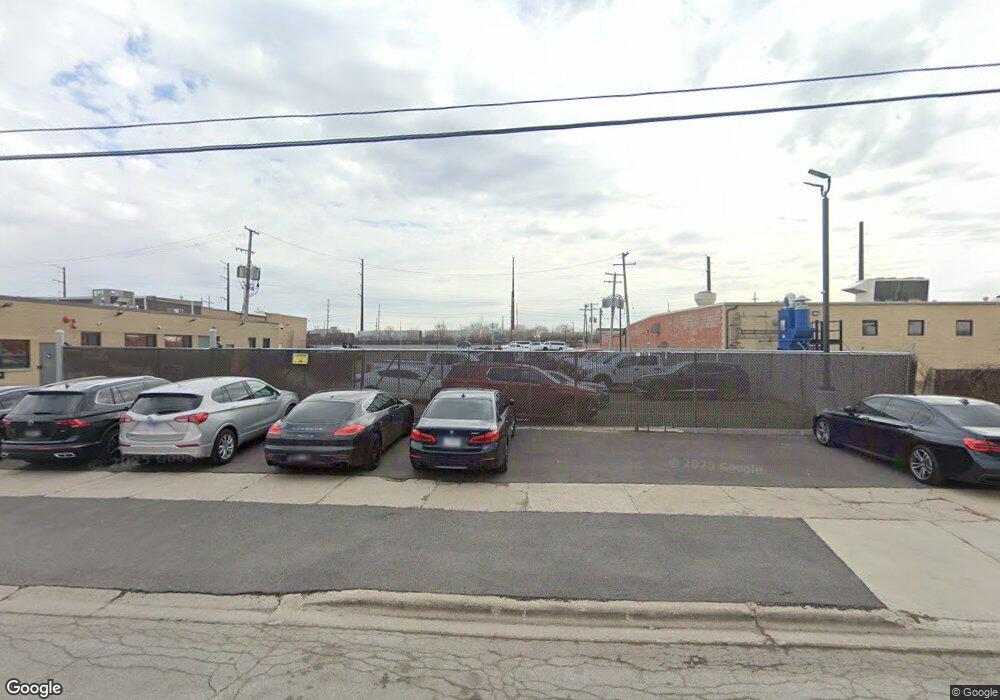
1521 N 31st Ave Melrose Park, IL 60160
Estimated Value: $327,490
--
Bed
--
Bath
--
Sq Ft
0.34
Acres
About This Home
This home is located at 1521 N 31st Ave, Melrose Park, IL 60160 and is currently priced at $327,490. 1521 N 31st Ave is a home located in Cook County with nearby schools including Grant Elementary School, Grant Primary, and Roosevelt Middle School.
Ownership History
Date
Name
Owned For
Owner Type
Purchase Details
Closed on
Nov 16, 2022
Sold by
Cn Group Llc
Bought by
Che Empire Llc
Current Estimated Value
Purchase Details
Closed on
Jul 28, 2016
Sold by
Chicago Title Land Trust Co
Bought by
Cn Group 228 Llc
Purchase Details
Closed on
Aug 6, 2014
Sold by
1529 North 31St Avenue Llc
Bought by
Cn Group Llc
Home Financials for this Owner
Home Financials are based on the most recent Mortgage that was taken out on this home.
Original Mortgage
$772,500
Interest Rate
5%
Mortgage Type
Commercial
Purchase Details
Closed on
Mar 30, 2007
Sold by
Federated Paint Manufacturing Co Inc
Bought by
1529 North 31St Avenue Llc
Home Financials for this Owner
Home Financials are based on the most recent Mortgage that was taken out on this home.
Original Mortgage
$916,000
Interest Rate
7.25%
Mortgage Type
Commercial
Purchase Details
Closed on
Jul 31, 2003
Sold by
Pioneer Powder Products Llc
Bought by
Federated Paint Manufacturing Co Inc
Create a Home Valuation Report for This Property
The Home Valuation Report is an in-depth analysis detailing your home's value as well as a comparison with similar homes in the area
Home Values in the Area
Average Home Value in this Area
Purchase History
| Date | Buyer | Sale Price | Title Company |
|---|---|---|---|
| Che Empire Llc | -- | None Listed On Document | |
| Cn Group 228 Llc | $230,000 | Chicago Title | |
| Cn Group Llc | $1,030,000 | First American Title | |
| 1529 North 31St Avenue Llc | $1,750,000 | Cti | |
| Federated Paint Manufacturing Co Inc | -- | -- |
Source: Public Records
Mortgage History
| Date | Status | Borrower | Loan Amount |
|---|---|---|---|
| Previous Owner | Cn Group Llc | $772,500 | |
| Previous Owner | 1529 North 31St Avenue Llc | $916,000 |
Source: Public Records
Tax History Compared to Growth
Tax History
| Year | Tax Paid | Tax Assessment Tax Assessment Total Assessment is a certain percentage of the fair market value that is determined by local assessors to be the total taxable value of land and additions on the property. | Land | Improvement |
|---|---|---|---|---|
| 2024 | $9,307 | $29,071 | $11,827 | $17,244 |
| 2023 | $43,267 | $29,071 | $11,827 | $17,244 |
| 2022 | $43,267 | $116,932 | $20,328 | $96,604 |
| 2021 | $27,231 | $73,869 | $20,328 | $53,541 |
| 2020 | $26,297 | $73,870 | $20,328 | $53,542 |
| 2019 | $18,435 | $48,777 | $16,632 | $32,145 |
| 2018 | $18,163 | $48,777 | $16,632 | $32,145 |
| 2017 | $17,458 | $48,777 | $16,632 | $32,145 |
| 2016 | $16,808 | $46,538 | $14,784 | $31,754 |
| 2015 | $16,276 | $46,538 | $14,784 | $31,754 |
| 2014 | $15,981 | $46,538 | $14,784 | $31,754 |
| 2013 | $19,929 | $63,534 | $14,784 | $48,750 |
Source: Public Records
Map
Nearby Homes
- 1512 N 32nd Ave
- 1502 N 34th Ave
- 1410 N 34th Ave
- 1619 N 35th Ave
- 1617 N 35th Ave
- 1502 N 35th Ave
- 1710 N 34th Ave
- 1707 N 35th Ave
- 1712 35th Ave
- 1306 36th Ave
- 1418 N 24th Ave
- 1531 N 24th Ave
- 1822 N 36th Ave
- 1514 N 22nd Ave
- 1739 N 24th Ave
- 1634 N 22nd Ave
- 1530 N 39th Ave
- 1528 N 39th Ave
- 1540 N 21st Ave
- 1616 N 40th Ave
- 1521 N 31st Ave
- 1529 N 31st Ave
- 1524 N 31st Ave
- 1522 N 31st Ave
- 1518 N 31st Ave
- 1534 N 31st Ave
- 1514 N 31st Ave
- 1514 N 31st Ave
- 1536 N 31st Ave
- 1510 N 31st Ave
- 1538 N 31st Ave
- 3103 Division St
- 3105 Division St
- 1521 N 32nd Ave
- 1519 N 32nd Ave
- 1525 N 32nd Ave
- 3109 Division St
- 1517 N 32nd Ave
- 1529 N 32nd Ave
- 1513 N 32nd Ave