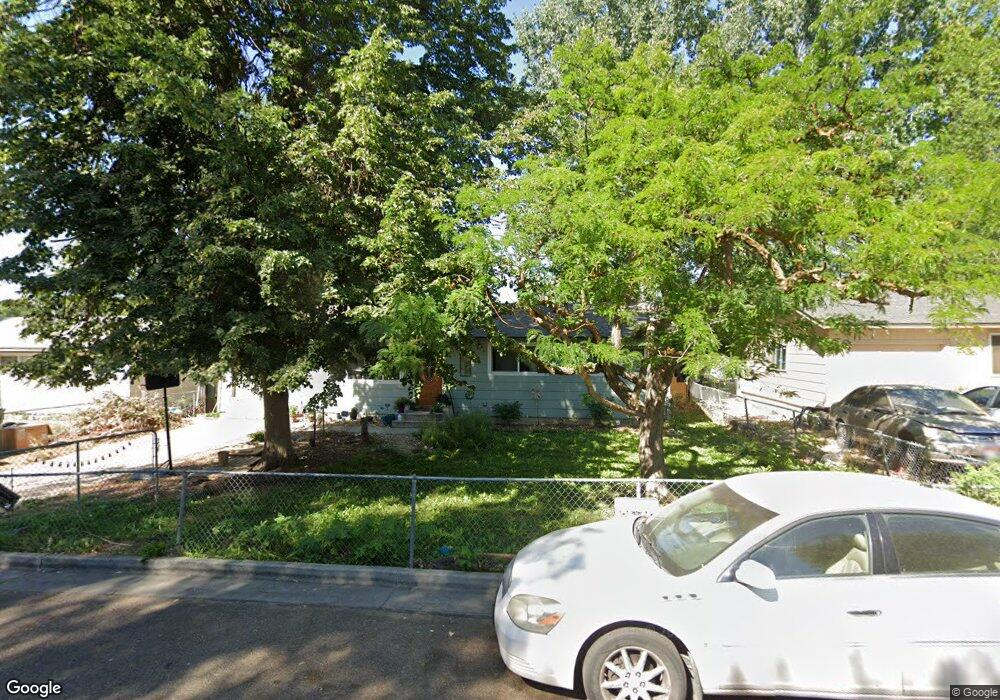
1521 N La Cresta Ave Caldwell, ID 83605
Estimated Value: $276,000 - $314,000
3
Beds
1
Bath
912
Sq Ft
$314/Sq Ft
Est. Value
About This Home
This home is located at 1521 N La Cresta Ave, Caldwell, ID 83605 and is currently estimated at $286,717, approximately $314 per square foot. 1521 N La Cresta Ave is a home located in Canyon County with nearby schools including Sacajawea Elementary School, Syringa Middle School, and Caldwell Senior High School.
Ownership History
Date
Name
Owned For
Owner Type
Purchase Details
Closed on
Nov 19, 2024
Sold by
Newby Timothy L
Bought by
Timothy Louis Newby Living Trust and Newby
Current Estimated Value
Purchase Details
Closed on
Sep 23, 2010
Sold by
Aurora Loan Services Llc
Bought by
Newby Tim
Purchase Details
Closed on
Sep 17, 2010
Sold by
Blackmon Alan and Bish Valerie
Bought by
Aurora Loan Services Llc
Purchase Details
Closed on
Oct 24, 2005
Sold by
Federal Home Loan Mortgage Corporation
Bought by
Blackmon Alan and Bish Valerie
Home Financials for this Owner
Home Financials are based on the most recent Mortgage that was taken out on this home.
Original Mortgage
$58,500
Interest Rate
5.97%
Mortgage Type
Fannie Mae Freddie Mac
Purchase Details
Closed on
Jul 13, 2005
Sold by
Wells Fargo Bank Na
Bought by
Federal Home Loan Mortgage Corporation
Create a Home Valuation Report for This Property
The Home Valuation Report is an in-depth analysis detailing your home's value as well as a comparison with similar homes in the area
Home Values in the Area
Average Home Value in this Area
Purchase History
| Date | Buyer | Sale Price | Title Company |
|---|---|---|---|
| Timothy Louis Newby Living Trust | -- | None Listed On Document | |
| Timothy Louis Newby Living Trust | -- | None Listed On Document | |
| Newby Tim | -- | Alliance Title Production | |
| Aurora Loan Services Llc | $113,009 | Lsi Title Agency Inc | |
| Blackmon Alan | -- | -- | |
| Federal Home Loan Mortgage Corporation | -- | -- |
Source: Public Records
Mortgage History
| Date | Status | Borrower | Loan Amount |
|---|---|---|---|
| Previous Owner | Blackmon Alan | $58,500 |
Source: Public Records
Tax History Compared to Growth
Tax History
| Year | Tax Paid | Tax Assessment Tax Assessment Total Assessment is a certain percentage of the fair market value that is determined by local assessors to be the total taxable value of land and additions on the property. | Land | Improvement |
|---|---|---|---|---|
| 2025 | $1,427 | $242,100 | $105,000 | $137,100 |
| 2024 | $1,427 | $232,200 | $93,300 | $138,900 |
| 2023 | $1,641 | $233,600 | $93,300 | $140,300 |
| 2022 | $1,952 | $258,600 | $105,000 | $153,600 |
| 2021 | $2,333 | $188,800 | $52,500 | $136,300 |
| 2020 | $2,304 | $154,400 | $37,900 | $116,500 |
| 2019 | $2,090 | $128,500 | $35,000 | $93,500 |
| 2018 | $1,863 | $0 | $0 | $0 |
| 2017 | $1,648 | $0 | $0 | $0 |
| 2016 | $1,555 | $0 | $0 | $0 |
| 2015 | $1,402 | $0 | $0 | $0 |
| 2014 | $1,418 | $66,200 | $17,500 | $48,700 |
Source: Public Records
Map
Nearby Homes
- 2401 Terrace Dr
- 1218 N Plateau Ave
- 1216 N Indiana Ave
- 1211 N Indiana Ave
- 1220 N Ohio Ave
- 1516 Monte Vista Dr
- 107 Nogales St
- 2302 Jackson St
- 11066 White River St
- 11078 White River St
- 111 W Madison St
- 2908 Dale Ln
- 2902 Dale Ln
- 2105 Marble Front Rd
- 2902 Bandit Ln
- 1505 Boise Ave
- 612 Danby Ave
- 217 Joliet St
- 3120 River Bluff Ct
- 3108 River Bluff Ct
- 1515 N La Cresta Ave
- 1603 N La Cresta Ave
- 1522 N Plateau Ave
- 1604 N Plateau Ave
- 1509 N La Cresta Ave
- 1609 N La Cresta Ave
- 1516 N Plateau Ave
- 1522 N La Cresta Ave
- 1516 N La Cresta Ave
- 1610 N Plateau Ave
- 1604 N La Cresta Ave
- 1512 N La Cresta Ave
- 1610 N La Cresta Ave
- 2220 Terrace Dr
- 2202 Terrace Dr
- 1506 N La Cresta Ave
- 2302 Terrace Dr
- 1521 N Plateau Ave
- 1603 N Plateau Ave
- 1517 Teton Ave