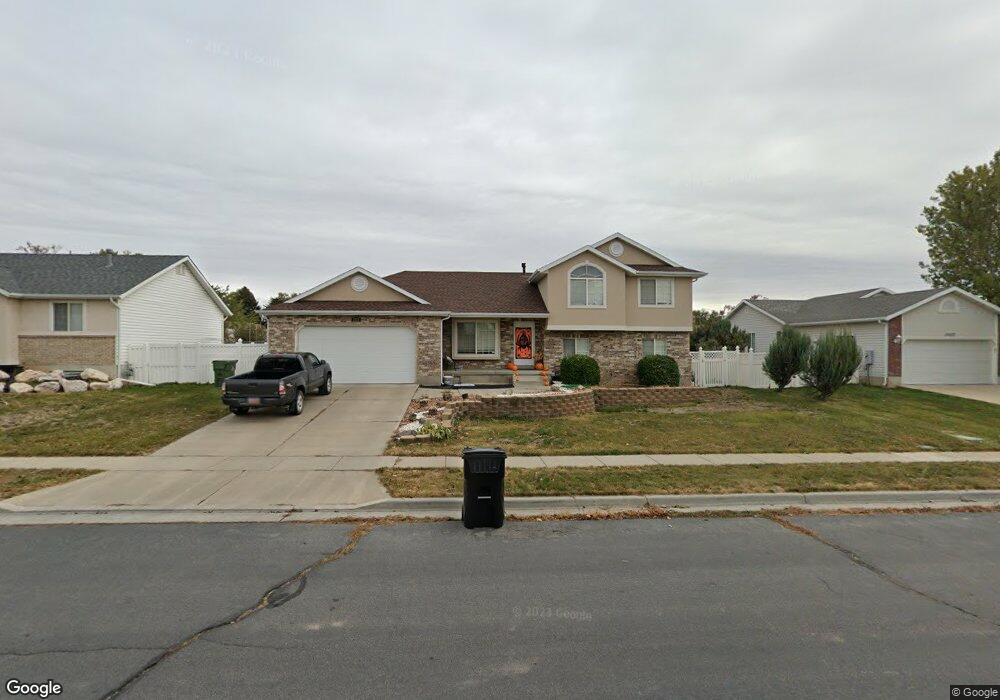
1521 S 1525 W Syracuse, UT 84075
Estimated Value: $488,000 - $531,000
4
Beds
3
Baths
2,591
Sq Ft
$198/Sq Ft
Est. Value
About This Home
This home is located at 1521 S 1525 W, Syracuse, UT 84075 and is currently estimated at $511,727, approximately $197 per square foot. 1521 S 1525 W is a home located in Davis County with nearby schools including Syracuse Elementary School, Syracuse Junior High School, and Syracuse High School.
Ownership History
Date
Name
Owned For
Owner Type
Purchase Details
Closed on
Nov 21, 2016
Sold by
Rose Kenneth C
Bought by
Pettersson Brandon and Pettersson Chantel
Current Estimated Value
Purchase Details
Closed on
Jul 30, 2007
Sold by
Jordan Todd D and Jordan Brook D
Bought by
Rose Kenneth C
Home Financials for this Owner
Home Financials are based on the most recent Mortgage that was taken out on this home.
Original Mortgage
$245,000
Interest Rate
6.73%
Mortgage Type
Purchase Money Mortgage
Purchase Details
Closed on
Jun 28, 1999
Sold by
Shepherd Scott
Bought by
Jordan Todd D and Jordan Brook D
Home Financials for this Owner
Home Financials are based on the most recent Mortgage that was taken out on this home.
Original Mortgage
$161,420
Interest Rate
7.2%
Purchase Details
Closed on
Dec 1, 1998
Sold by
New Hampton Manor Associates
Bought by
Shepherd Scott
Create a Home Valuation Report for This Property
The Home Valuation Report is an in-depth analysis detailing your home's value as well as a comparison with similar homes in the area
Home Values in the Area
Average Home Value in this Area
Purchase History
| Date | Buyer | Sale Price | Title Company |
|---|---|---|---|
| Pettersson Brandon | -- | Stewart Title | |
| Rose Kenneth C | -- | First American Title | |
| Jordan Todd D | -- | Bonneville Title Company Inc | |
| Shepherd Scott | -- | Security Title |
Source: Public Records
Mortgage History
| Date | Status | Borrower | Loan Amount |
|---|---|---|---|
| Previous Owner | Rose Kenneth C | $245,000 | |
| Previous Owner | Jordan Todd D | $161,420 |
Source: Public Records
Tax History Compared to Growth
Tax History
| Year | Tax Paid | Tax Assessment Tax Assessment Total Assessment is a certain percentage of the fair market value that is determined by local assessors to be the total taxable value of land and additions on the property. | Land | Improvement |
|---|---|---|---|---|
| 2025 | $2,702 | $260,700 | $121,530 | $139,170 |
| 2024 | $2,593 | $251,900 | $97,343 | $154,557 |
| 2023 | $2,407 | $426,000 | $135,814 | $290,186 |
| 2022 | $2,619 | $254,100 | $78,610 | $175,490 |
| 2021 | $2,317 | $348,000 | $115,812 | $232,188 |
| 2020 | $2,063 | $300,000 | $102,470 | $197,530 |
| 2019 | $1,964 | $282,000 | $98,226 | $183,774 |
| 2018 | $1,930 | $275,000 | $95,900 | $179,100 |
| 2016 | $1,686 | $126,005 | $36,880 | $89,125 |
| 2015 | $1,631 | $116,105 | $36,880 | $79,225 |
| 2014 | $1,551 | $112,486 | $36,880 | $75,606 |
| 2013 | -- | $106,054 | $32,054 | $74,000 |
Source: Public Records
Map
Nearby Homes
- 1537 S 1525 W
- 1505 S 1525 W
- 1600 Marilyn Dr
- 1610 Marilyn Dr
- 2661 S 1525 W
- 2661 S 1525 W Unit 117
- 1580 Marilyn Dr
- 1487 S 1525 W
- 1549 S 1525 W
- 1549 S 1525 W Unit 14
- 1547 W 1500 S
- 1547 W 1500 S Unit 9
- 1530 S 1525 W
- 1545 W 1500 S Unit 8
- 1564 Marilyn Dr
- 1546 S 1525 W
- 1616 Marilyn Dr
- 1546 W 1500 S
- 1471 S 1525 W
- 1579 W 1500 S