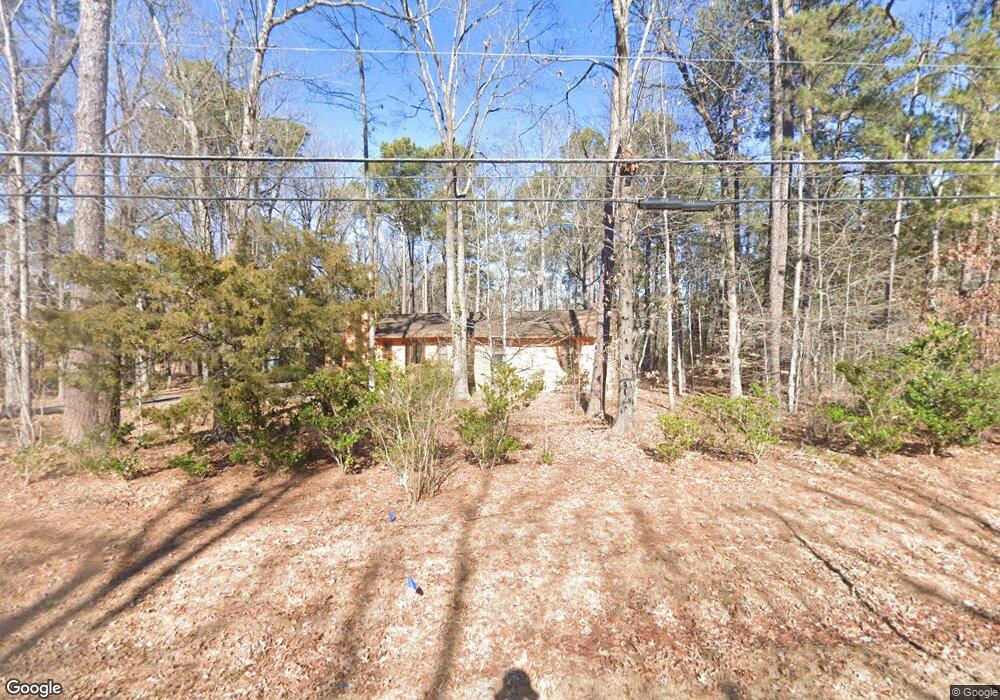
1521 Sedwick Rd Durham, NC 27713
Estimated Value: $355,000 - $461,000
3
Beds
2
Baths
1,803
Sq Ft
$229/Sq Ft
Est. Value
About This Home
This home is located at 1521 Sedwick Rd, Durham, NC 27713 and is currently estimated at $412,012, approximately $228 per square foot. 1521 Sedwick Rd is a home located in Durham County with nearby schools including Parkwood Elementary, Lowe's Grove Middle, and Hillside High School.
Ownership History
Date
Name
Owned For
Owner Type
Purchase Details
Closed on
Sep 26, 2019
Sold by
Ward Patricia Louise and Ward Terence
Bought by
Ganta Ashok and Ganta Anitha
Current Estimated Value
Purchase Details
Closed on
Oct 16, 2009
Sold by
Ward Patricia Louise and The Estate Of Paula Gene Loyd
Bought by
Ward Patricia Louise and Ward Terence
Purchase Details
Closed on
Apr 11, 2007
Sold by
Norman Sharon L and Sims Larry
Bought by
Loyd Paula G
Home Financials for this Owner
Home Financials are based on the most recent Mortgage that was taken out on this home.
Original Mortgage
$147,920
Interest Rate
6.15%
Mortgage Type
Purchase Money Mortgage
Purchase Details
Closed on
Jul 19, 2004
Sold by
Cornwell Donald R and Thomsen Linda K
Bought by
Norman Sharon L
Home Financials for this Owner
Home Financials are based on the most recent Mortgage that was taken out on this home.
Original Mortgage
$75,000
Interest Rate
6.24%
Mortgage Type
Purchase Money Mortgage
Create a Home Valuation Report for This Property
The Home Valuation Report is an in-depth analysis detailing your home's value as well as a comparison with similar homes in the area
Home Values in the Area
Average Home Value in this Area
Purchase History
| Date | Buyer | Sale Price | Title Company |
|---|---|---|---|
| Ganta Ashok | $205,000 | None Available | |
| Ward Patricia Louise | -- | None Available | |
| Loyd Paula G | $186,500 | None Available | |
| Norman Sharon L | $165,000 | -- |
Source: Public Records
Mortgage History
| Date | Status | Borrower | Loan Amount |
|---|---|---|---|
| Previous Owner | Loyd Paula G | $147,920 | |
| Previous Owner | Norman Sharon L | $75,000 |
Source: Public Records
Tax History Compared to Growth
Tax History
| Year | Tax Paid | Tax Assessment Tax Assessment Total Assessment is a certain percentage of the fair market value that is determined by local assessors to be the total taxable value of land and additions on the property. | Land | Improvement |
|---|---|---|---|---|
| 2025 | $3,809 | $384,246 | $214,720 | $169,526 |
| 2024 | $3,370 | $241,595 | $86,503 | $155,092 |
| 2023 | $3,165 | $241,595 | $86,503 | $155,092 |
| 2022 | $3,092 | $241,595 | $86,503 | $155,092 |
| 2021 | $3,078 | $241,595 | $86,503 | $155,092 |
| 2020 | $3,005 | $241,595 | $86,503 | $155,092 |
| 2019 | $3,005 | $241,595 | $86,503 | $155,092 |
| 2018 | $2,537 | $187,029 | $66,810 | $120,219 |
| 2017 | $2,518 | $187,029 | $66,810 | $120,219 |
| 2016 | $2,433 | $187,029 | $66,810 | $120,219 |
| 2015 | $2,417 | $174,574 | $34,654 | $139,920 |
| 2014 | $2,417 | $174,574 | $34,654 | $139,920 |
Source: Public Records
Map
Nearby Homes
- 1445 Sedwick Rd
- 104 Deblyn Ct
- 5320 Newhall Rd
- 5817 Newhall Rd
- 1317 Elmset Ln
- 1621 Clermont Rd
- 1409 Haventree Rd
- 1510 Haventree Rd
- 1909 Piperwood Ct
- 2 Donnelly Ct
- 5504 Pelham Rd
- 6010 Newhall Rd
- 1304 Seaton Rd Unit 1
- 1304 Seaton Rd Unit 24
- 6353 Grandale Dr
- 1728 Euclid Rd
- 1227 Seaton Rd Unit 54
- 1109 Seaton Rd
- 115 Lattimore Ln
- 1021 Park Glen Place
- 1509 Sedwick Rd
- 0 Verna Place
- 1525 Sedwick Rd
- 1507 Sedwick Rd
- 1522 Sedwick Rd
- 139 Radcliff Cir
- 1529 Sedwick Rd
- 1528 Sedwick Rd
- 137 Radcliff Cir
- 1505 Sedwick Rd
- 1506 Sedwick Rd
- 141 Radcliff Cir
- 1530 Sedwick Rd
- 1504 Sedwick Rd
- 135 Radcliff Cir
- 1503 Sedwick Rd
- 1523 Sedwick Rd
- 5501 Frenchmans Creek Dr
- 143 Radcliff Cir
- 5503 Frenchmans Creek Dr