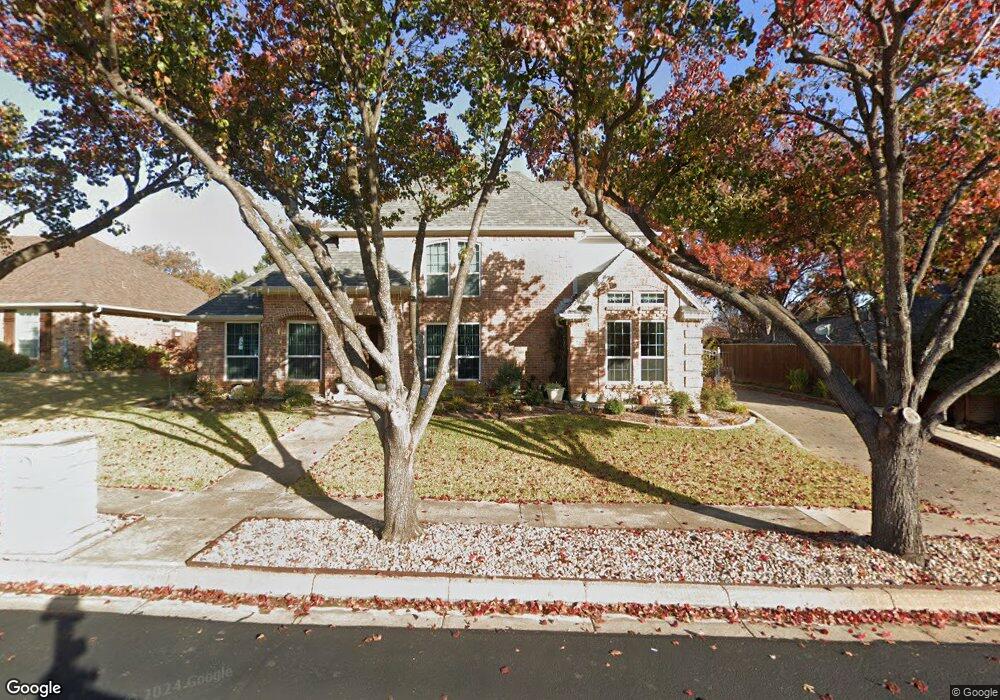
1521 Wimberly Ct Bedford, TX 76021
Estimated Value: $483,526 - $551,000
3
Beds
2
Baths
2,252
Sq Ft
$227/Sq Ft
Est. Value
About This Home
This home is located at 1521 Wimberly Ct, Bedford, TX 76021 and is currently estimated at $512,132, approximately $227 per square foot. 1521 Wimberly Ct is a home located in Tarrant County with nearby schools including Bedford Heights Elementary School, Bedford Junior High School, and L.D. Bell High School.
Ownership History
Date
Name
Owned For
Owner Type
Purchase Details
Closed on
Feb 9, 2017
Sold by
Vogt Manfred
Bought by
Vogt Manfred and Vogt Ann Egret
Current Estimated Value
Home Financials for this Owner
Home Financials are based on the most recent Mortgage that was taken out on this home.
Original Mortgage
$103,500
Outstanding Balance
$85,694
Interest Rate
4.2%
Mortgage Type
New Conventional
Estimated Equity
$426,438
Purchase Details
Closed on
Mar 30, 2000
Sold by
Burkhart Bryan and Burkhart Cindy S
Bought by
Vogt Manfred
Home Financials for this Owner
Home Financials are based on the most recent Mortgage that was taken out on this home.
Original Mortgage
$134,000
Interest Rate
7.87%
Purchase Details
Closed on
Nov 27, 1995
Sold by
Denmam David Lamar and Denmam Linda Lee
Bought by
Burkhart Bryan and Burkhart Cindy S
Home Financials for this Owner
Home Financials are based on the most recent Mortgage that was taken out on this home.
Original Mortgage
$126,800
Interest Rate
7.36%
Create a Home Valuation Report for This Property
The Home Valuation Report is an in-depth analysis detailing your home's value as well as a comparison with similar homes in the area
Home Values in the Area
Average Home Value in this Area
Purchase History
| Date | Buyer | Sale Price | Title Company |
|---|---|---|---|
| Vogt Manfred | -- | First American Title Ins Co | |
| Vogt Manfred | -- | -- | |
| Burkhart Bryan | -- | First American Title Co |
Source: Public Records
Mortgage History
| Date | Status | Borrower | Loan Amount |
|---|---|---|---|
| Open | Vogt Manfred | $103,500 | |
| Closed | Vogt Manfred | $134,000 | |
| Previous Owner | Burkhart Bryan | $126,800 | |
| Closed | Vogt Manfred | $16,750 |
Source: Public Records
Tax History Compared to Growth
Tax History
| Year | Tax Paid | Tax Assessment Tax Assessment Total Assessment is a certain percentage of the fair market value that is determined by local assessors to be the total taxable value of land and additions on the property. | Land | Improvement |
|---|---|---|---|---|
| 2025 | $2,403 | $400,000 | $90,000 | $310,000 |
| 2024 | $2,403 | $400,000 | $90,000 | $310,000 |
| 2023 | $7,595 | $413,000 | $75,000 | $338,000 |
| 2022 | $7,863 | $360,000 | $75,000 | $285,000 |
| 2021 | $8,263 | $350,765 | $75,000 | $275,765 |
| 2020 | $7,627 | $320,797 | $75,000 | $245,797 |
| 2019 | $7,775 | $332,956 | $75,000 | $257,956 |
| 2018 | $4,203 | $290,957 | $75,000 | $215,957 |
| 2017 | $6,399 | $281,467 | $25,000 | $256,467 |
| 2016 | $5,817 | $254,961 | $25,000 | $229,961 |
| 2015 | $4,181 | $218,600 | $25,000 | $193,600 |
| 2014 | $4,181 | $218,600 | $25,000 | $193,600 |
Source: Public Records
Map
Nearby Homes
- 3827 Ashbury Ln
- 1421 Plantation Dr N
- 1303 Crest Dr
- 3907 Windermere Dr
- 1136 Wingate Dr
- 3907 Copperwood Ct
- 4002 Copperwood Ct
- 1820 Wimbleton Dr
- 1209 Hillandale Ct
- 1109 Simpson Terrace
- 1800 Hampton Dr
- 3301 Wendover Ct
- 2001 Oak Knoll Dr
- 2204 Woodstock Dr
- 3813 Brookridge Ct
- 3624 Wayne Ct
- 4105 Inwood Ln
- 3513 Meadowside Dr
- 3840 Edgewater Dr
- 2209 Laurel Ct
- 1517 Wimberly Ct
- 1525 Wimberly Ct
- 1500 Woodvale Dr
- 1504 Woodvale Dr
- 1513 Wimberly Ct
- 1524 Wimberly Ct
- 1416 Woodvale Dr
- 1508 Woodvale Dr
- 1520 Wimberly Ct
- 1516 Wimberly Ct
- 1509 Wimberly Ct
- 1412 Woodvale Dr
- 3816 Wimberly Dr
- 3820 Wimberly Dr
- 3812 Wimberly Dr
- 3824 Wimberly Dr
- 1421 Brookshire Dr
- 1512 Wimberly Ct
- 1505 Woodvale Dr
- 3808 Wimberly Dr