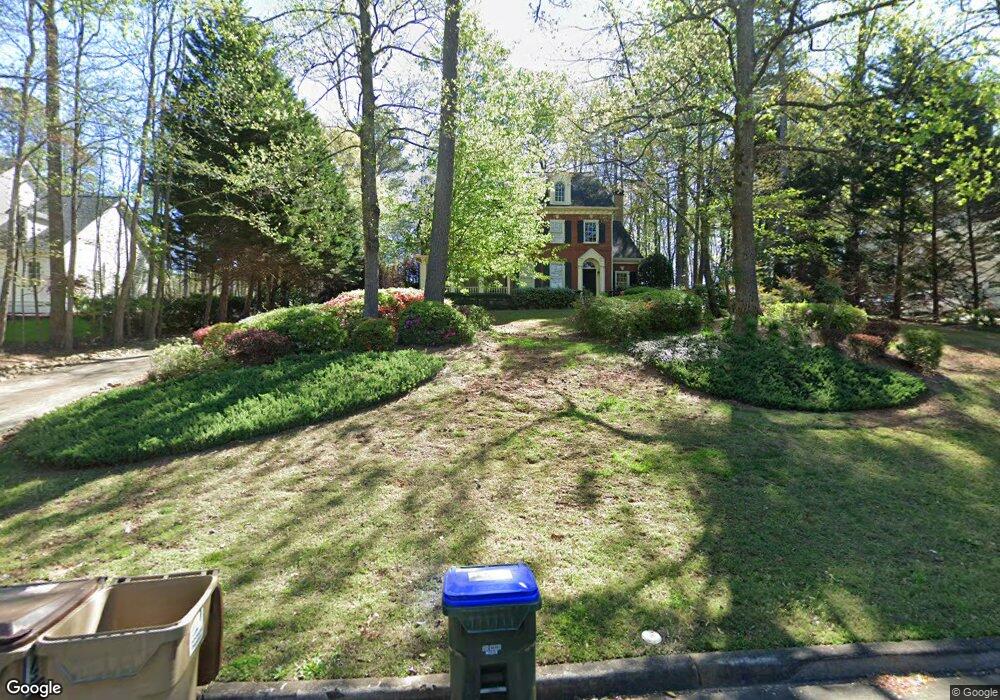
15215 Sandpoint Trace Unit 1 Alpharetta, GA 30004
Estimated Value: $749,660 - $941,000
4
Beds
3
Baths
2,860
Sq Ft
$297/Sq Ft
Est. Value
About This Home
This home is located at 15215 Sandpoint Trace Unit 1, Alpharetta, GA 30004 and is currently estimated at $848,415, approximately $296 per square foot. 15215 Sandpoint Trace Unit 1 is a home located in Fulton County with nearby schools including Summit Hill Elementary School, Hopewell Middle School, and Cambridge High School.
Ownership History
Date
Name
Owned For
Owner Type
Purchase Details
Closed on
Aug 17, 2006
Sold by
Weiner Deborah
Bought by
Weiner Deborah and Aseere Nancy
Current Estimated Value
Home Financials for this Owner
Home Financials are based on the most recent Mortgage that was taken out on this home.
Original Mortgage
$290,400
Outstanding Balance
$173,498
Interest Rate
6.67%
Mortgage Type
New Conventional
Estimated Equity
$674,917
Purchase Details
Closed on
Apr 16, 1999
Sold by
Schilling Brian
Bought by
Avery William G and Avery Tracy S
Home Financials for this Owner
Home Financials are based on the most recent Mortgage that was taken out on this home.
Original Mortgage
$173,600
Interest Rate
7.13%
Mortgage Type
New Conventional
Purchase Details
Closed on
Dec 17, 1993
Sold by
Macauley Props Ltd
Bought by
Simpson John T Kathryn P
Home Financials for this Owner
Home Financials are based on the most recent Mortgage that was taken out on this home.
Original Mortgage
$175,650
Interest Rate
7.1%
Create a Home Valuation Report for This Property
The Home Valuation Report is an in-depth analysis detailing your home's value as well as a comparison with similar homes in the area
Home Values in the Area
Average Home Value in this Area
Purchase History
| Date | Buyer | Sale Price | Title Company |
|---|---|---|---|
| Weiner Deborah | -- | -- | |
| Weiner Deborah | $363,000 | -- | |
| Avery William G | $217,000 | -- | |
| Simpson John T Kathryn P | $184,900 | -- |
Source: Public Records
Mortgage History
| Date | Status | Borrower | Loan Amount |
|---|---|---|---|
| Open | Weiner Deborah | $290,400 | |
| Previous Owner | Avery William G | $173,600 | |
| Previous Owner | Simpson John T Kathryn P | $175,650 |
Source: Public Records
Tax History Compared to Growth
Tax History
| Year | Tax Paid | Tax Assessment Tax Assessment Total Assessment is a certain percentage of the fair market value that is determined by local assessors to be the total taxable value of land and additions on the property. | Land | Improvement |
|---|---|---|---|---|
| 2025 | $692 | $262,560 | $67,560 | $195,000 |
| 2023 | $4,820 | $170,760 | $33,200 | $137,560 |
| 2022 | $3,626 | $170,760 | $33,200 | $137,560 |
| 2021 | $3,613 | $151,680 | $29,840 | $121,840 |
| 2020 | $3,647 | $149,880 | $29,480 | $120,400 |
| 2019 | $683 | $147,240 | $28,960 | $118,280 |
| 2018 | $3,638 | $143,760 | $28,280 | $115,480 |
| 2017 | $3,579 | $135,360 | $20,720 | $114,640 |
| 2016 | $3,560 | $135,360 | $20,720 | $114,640 |
| 2015 | $4,142 | $135,360 | $20,720 | $114,640 |
| 2014 | $3,686 | $135,280 | $20,720 | $114,560 |
Source: Public Records
Map
Nearby Homes
- 125 Crabapple Way
- 3630 Hamby Oaks Dr
- 3309 Hamby Rd
- 15794 S Thompson Rd
- 16050 Thompson Rd
- 15785 S Thompson Rd
- 15792 S Thompson Rd
- 125 Hopewell Grove Dr
- 3510 Hamby Oaks Dr
- 160 Stone Orchard Ct
- 2060 Magnolia Ln Unit 8
- 5071 Kings Close
- 515 Cottage Dr
- 513 Cottage Dr
- 5855 Wills Lake Rd
- 3084 Watsons Bend
- 3084 Watson's Bend
- 2053 Magnolia Ln Unit 10
- 515 Watboro Hill Dr
- 3635 Cottage Dr
- 15205 Sandpoint Trace
- 15225 Sandpoint Trace
- 15195 Sandpoint Trace
- 15210 Sandpoint Trace
- 15185 Sandpoint Trace Unit 1
- 3370 Plantation Trace
- 0 Sandpoint Trace
- 15175 Sandpoint Trace
- 3360 Plantation Trace
- 15165 Sandpoint Trace
- 0 Crabapple Ct Unit 7459395
- 0 Crabapple Ct
- 310 Crabapple Ct
- 15180 Sandpoint Trace
- 15155 Sandpoint Trace
- 315 Crabapple Ct Unit 1
- 3550 Hamby Rd
- 3355 Plantation Trace
- 3560 Hamby Rd
- 3345 Plantation Trace