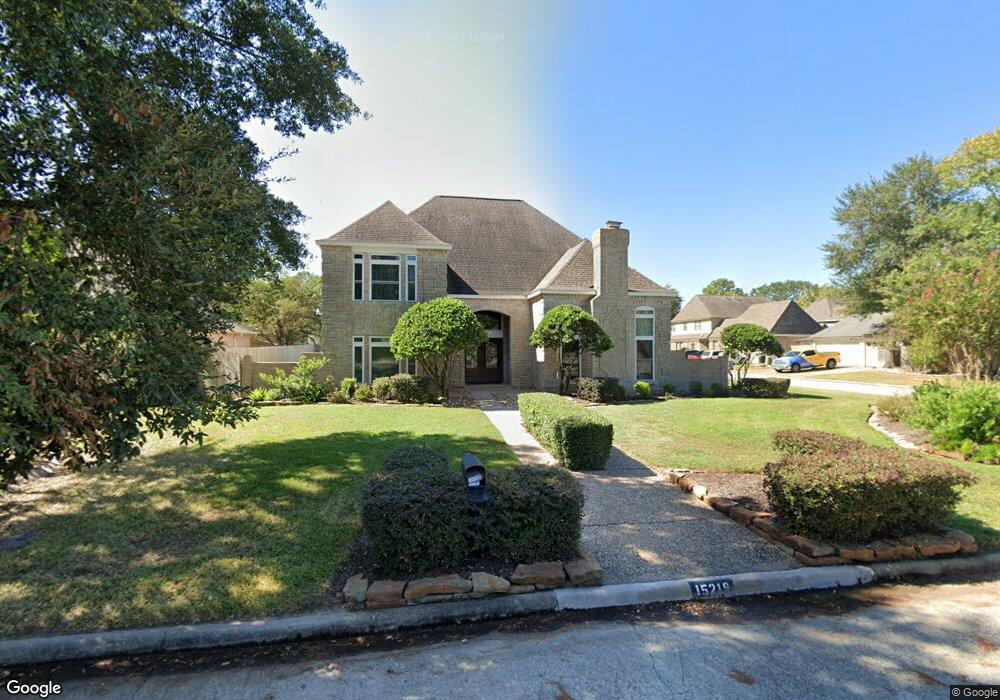
15219 T c Jester Blvd Houston, TX 77068
Champions NeighborhoodEstimated Value: $420,000 - $474,000
4
Beds
4
Baths
3,892
Sq Ft
$113/Sq Ft
Est. Value
About This Home
This home is located at 15219 T c Jester Blvd, Houston, TX 77068 and is currently estimated at $438,340, approximately $112 per square foot. 15219 T c Jester Blvd is a home located in Harris County with nearby schools including Pat Reynolds Elementary School, Edwin M. Wells Middle School, and Westfield High School.
Ownership History
Date
Name
Owned For
Owner Type
Purchase Details
Closed on
Nov 24, 2020
Sold by
Murray Philip F and Murray Lucinda M
Bought by
Murray Lucinda M and Murray Philip F
Current Estimated Value
Purchase Details
Closed on
Nov 16, 1999
Sold by
Reagent Chemical & Research Inc
Bought by
Murray Philip F
Home Financials for this Owner
Home Financials are based on the most recent Mortgage that was taken out on this home.
Original Mortgage
$153,000
Interest Rate
7.76%
Mortgage Type
Seller Take Back
Purchase Details
Closed on
Aug 19, 1994
Sold by
Brown Betty Jo and Brown Walter Ray
Bought by
Meyercord Barbara M
Home Financials for this Owner
Home Financials are based on the most recent Mortgage that was taken out on this home.
Original Mortgage
$122,307
Interest Rate
8.66%
Create a Home Valuation Report for This Property
The Home Valuation Report is an in-depth analysis detailing your home's value as well as a comparison with similar homes in the area
Home Values in the Area
Average Home Value in this Area
Purchase History
| Date | Buyer | Sale Price | Title Company |
|---|---|---|---|
| Murray Lucinda M | -- | None Listed On Document | |
| Murray Philip F | -- | American Title Co | |
| Murray Philip F | -- | American Title Co | |
| Meyercord Barbara M | -- | Charter Title Company |
Source: Public Records
Mortgage History
| Date | Status | Borrower | Loan Amount |
|---|---|---|---|
| Previous Owner | Murray Philip F | $153,000 | |
| Previous Owner | Murray Philip F | $170,409 | |
| Previous Owner | Meyercord Barbara M | $122,307 | |
| Closed | Murray Philip F | $11,033 |
Source: Public Records
Tax History Compared to Growth
Tax History
| Year | Tax Paid | Tax Assessment Tax Assessment Total Assessment is a certain percentage of the fair market value that is determined by local assessors to be the total taxable value of land and additions on the property. | Land | Improvement |
|---|---|---|---|---|
| 2025 | $2,351 | $409,073 | $59,259 | $349,814 |
| 2024 | $2,351 | $417,259 | $59,259 | $358,000 |
| 2023 | $2,351 | $409,381 | $59,259 | $350,122 |
| 2022 | $7,450 | $394,211 | $41,026 | $353,185 |
| 2021 | $7,219 | $309,854 | $41,026 | $268,828 |
| 2020 | $7,095 | $285,103 | $41,814 | $243,289 |
| 2019 | $6,804 | $262,841 | $41,814 | $221,027 |
| 2018 | $4,624 | $258,935 | $41,814 | $217,121 |
| 2017 | $6,610 | $258,935 | $41,814 | $217,121 |
| 2016 | $6,221 | $243,690 | $41,814 | $201,876 |
| 2015 | $4,796 | $243,690 | $41,814 | $201,876 |
| 2014 | $4,796 | $213,299 | $32,522 | $180,777 |
Source: Public Records
Map
Nearby Homes
- 3507 Shanemoss Ct
- 3015 Green Vista
- 3419 Brimwood Dr
- 3527 Highfalls Dr
- 15222 Lantern Creek Ln
- 15406 Dawn Meadows Dr
- 3410 Amber Forest Dr
- 3434 Amber Forest Dr
- 3303 Amber Forest Dr
- 3615 Highfalls Dr
- 15002 Walters Rd
- 15119 Pebble Bend Dr
- 3310 Manor Tree Ln
- 3218 Manor Tree Ln
- 3515 Stoney Oak Dr
- 15026 Falling Creek Dr
- 15402 Cresent Oaks Ct
- 3307 Manor Tree Ln
- 3706 Brookbank Dr
- 3502 Stoney Oak Dr
- 15215 T c Jester Blvd
- 15138 Ripplewind Ln
- 15134 Ripplewind Ln
- 15303 T c Jester Blvd
- 15211 T c Jester Blvd
- 15202 Ripplewind Ln
- 15130 Ripplewind Ln
- 15218 T c Jester Blvd
- 15307 T c Jester Blvd
- 15207 T c Jester Blvd
- 15206 Ripplewind Ln
- 15214 T C Jester Blvd
- 15126 Ripplewind Ln
- 15302 T c Jester Blvd
- 15139 Ripplewind Ln
- 15135 Ripplewind Ln
- 15311 T c Jester Blvd
- 15203 T c Jester Blvd
- 15210 Ripplewind Ln
- 15206 T c Jester Blvd