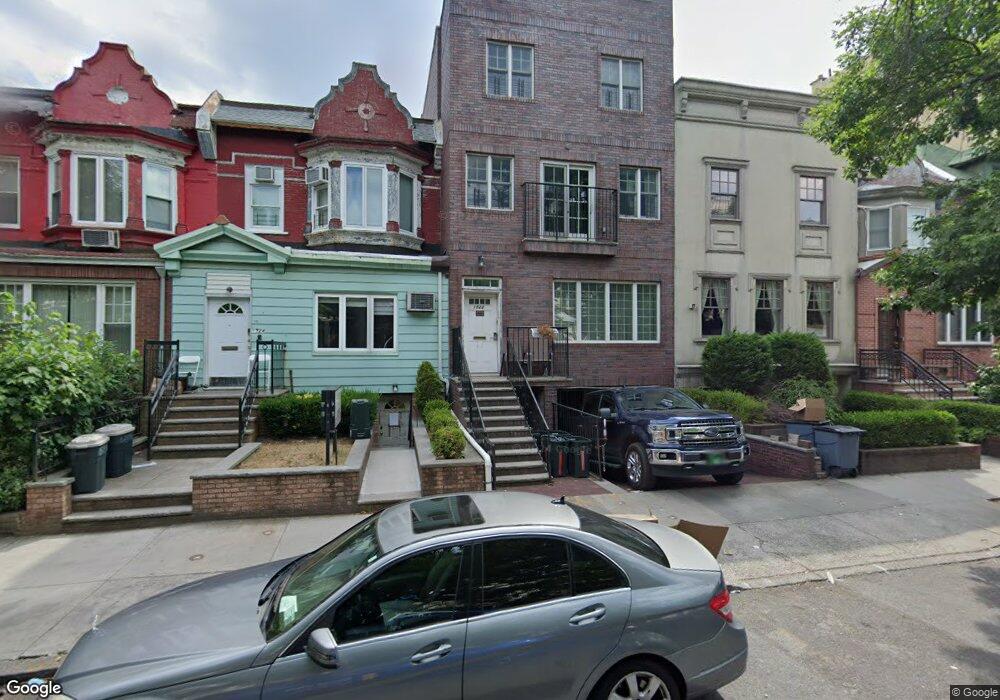
1522 44th St Brooklyn, NY 11219
Borough Park NeighborhoodEstimated Value: $1,601,000 - $2,607,000
--
Bed
--
Bath
3,250
Sq Ft
$641/Sq Ft
Est. Value
About This Home
This home is located at 1522 44th St, Brooklyn, NY 11219 and is currently estimated at $2,081,799, approximately $640 per square foot. 1522 44th St is a home located in Kings County with nearby schools including P.S. 164 Caesar Rodney School, I.S. 223 The Montauk, and Franklin Delano Roosevelt High School.
Ownership History
Date
Name
Owned For
Owner Type
Purchase Details
Closed on
Jan 29, 2008
Sold by
Zehnwirth Abraham
Bought by
Rylb 44Th Street Llc
Current Estimated Value
Purchase Details
Closed on
Apr 19, 2007
Sold by
Bodner Pearl
Bought by
Zehnwirth Abraham
Home Financials for this Owner
Home Financials are based on the most recent Mortgage that was taken out on this home.
Original Mortgage
$600,000
Interest Rate
6.23%
Mortgage Type
Purchase Money Mortgage
Create a Home Valuation Report for This Property
The Home Valuation Report is an in-depth analysis detailing your home's value as well as a comparison with similar homes in the area
Home Values in the Area
Average Home Value in this Area
Purchase History
| Date | Buyer | Sale Price | Title Company |
|---|---|---|---|
| Rylb 44Th Street Llc | $1,050,000 | -- | |
| Rylb 44Th Street Llc | $1,050,000 | -- | |
| Zehnwirth Abraham | $750,000 | -- | |
| Zehnwirth Abraham | $750,000 | -- |
Source: Public Records
Mortgage History
| Date | Status | Borrower | Loan Amount |
|---|---|---|---|
| Previous Owner | Zehnwirth Abraham | $600,000 |
Source: Public Records
Tax History Compared to Growth
Tax History
| Year | Tax Paid | Tax Assessment Tax Assessment Total Assessment is a certain percentage of the fair market value that is determined by local assessors to be the total taxable value of land and additions on the property. | Land | Improvement |
|---|---|---|---|---|
| 2025 | $8,591 | $112,440 | $14,400 | $98,040 |
| 2024 | $8,591 | $103,980 | $14,400 | $89,580 |
| 2023 | $8,196 | $107,220 | $14,400 | $92,820 |
| 2022 | $6,551 | $112,560 | $14,400 | $98,160 |
| 2021 | $5,134 | $108,540 | $14,400 | $94,140 |
| 2020 | $5,209 | $100,320 | $14,400 | $85,920 |
| 2019 | $7,457 | $100,320 | $14,400 | $85,920 |
| 2018 | $6,855 | $33,628 | $6,247 | $27,381 |
| 2017 | $6,563 | $32,196 | $6,226 | $25,970 |
| 2016 | $6,150 | $30,762 | $7,018 | $23,744 |
| 2015 | $3,663 | $30,758 | $6,381 | $24,377 |
| 2014 | $3,663 | $29,705 | $5,859 | $23,846 |
Source: Public Records
Map
Nearby Homes