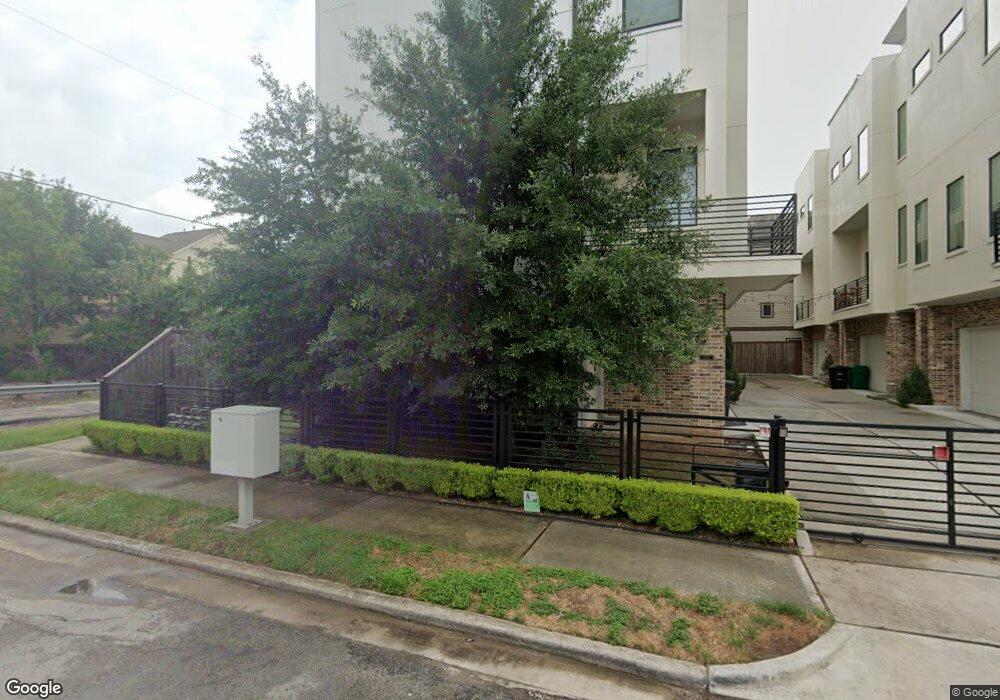
1522 Colorado St Houston, TX 77007
Sixth Ward NeighborhoodEstimated Value: $485,000 - $563,000
3
Beds
4
Baths
2,278
Sq Ft
$230/Sq Ft
Est. Value
About This Home
This home is located at 1522 Colorado St, Houston, TX 77007 and is currently estimated at $524,647, approximately $230 per square foot. 1522 Colorado St is a home located in Harris County with nearby schools including Crockett Elementary School, Hogg Middle, and Heights High School.
Ownership History
Date
Name
Owned For
Owner Type
Purchase Details
Closed on
Mar 28, 2018
Sold by
Asian Pacific Texas Llc
Bought by
Mchenry William
Current Estimated Value
Home Financials for this Owner
Home Financials are based on the most recent Mortgage that was taken out on this home.
Original Mortgage
$343,200
Outstanding Balance
$294,734
Interest Rate
4.38%
Mortgage Type
New Conventional
Estimated Equity
$229,913
Purchase Details
Closed on
Nov 29, 2012
Sold by
Asian Pacific Texas Llc
Bought by
Australtex Investment Holdings Llc
Purchase Details
Closed on
Oct 18, 2007
Sold by
Manderscheid Shawn
Bought by
Tahc 1 Llc
Purchase Details
Closed on
Jan 31, 2006
Sold by
Dale Ron
Bought by
Tcm Group Inc
Purchase Details
Closed on
Sep 22, 2004
Sold by
Abrego Ventures Inc
Bought by
Dale Ron
Purchase Details
Closed on
Aug 19, 2002
Sold by
Ingram Marguerite Chelsea
Bought by
Abrego Ventures
Create a Home Valuation Report for This Property
The Home Valuation Report is an in-depth analysis detailing your home's value as well as a comparison with similar homes in the area
Home Values in the Area
Average Home Value in this Area
Purchase History
| Date | Buyer | Sale Price | Title Company |
|---|---|---|---|
| Mchenry William | -- | None Available | |
| Australtex Investment Holdings Llc | -- | None Available | |
| Tahc 1 Llc | -- | None Available | |
| Tcm Group Inc | -- | None Available | |
| Dale Ron | -- | American Title Co | |
| Abrego Ventures | -- | American Title Co |
Source: Public Records
Mortgage History
| Date | Status | Borrower | Loan Amount |
|---|---|---|---|
| Open | Mchenry William | $343,200 |
Source: Public Records
Tax History Compared to Growth
Tax History
| Year | Tax Paid | Tax Assessment Tax Assessment Total Assessment is a certain percentage of the fair market value that is determined by local assessors to be the total taxable value of land and additions on the property. | Land | Improvement |
|---|---|---|---|---|
| 2025 | $7,579 | $490,341 | $106,260 | $384,081 |
| 2024 | $7,579 | $512,000 | $86,336 | $425,664 |
| 2023 | $7,579 | $458,000 | $77,924 | $380,076 |
| 2022 | $10,393 | $440,000 | $70,840 | $369,160 |
| 2021 | $10,001 | $429,084 | $88,550 | $340,534 |
| 2020 | $10,788 | $445,500 | $88,550 | $356,950 |
| 2019 | $10,856 | $429,000 | $88,550 | $340,450 |
| 2018 | $11,209 | $442,963 | $70,840 | $372,123 |
| 2017 | $11,201 | $442,963 | $70,840 | $372,123 |
| 2016 | $11,201 | $442,963 | $70,840 | $372,123 |
| 2015 | $1,821 | $227,667 | $70,840 | $156,827 |
| 2014 | $1,821 | $0 | $0 | $0 |
Source: Public Records
Map
Nearby Homes
- 1620 Bingham St
- 1508 Sabine St
- 0 Edwards St Unit 15793282
- 1705 Crockett St Unit B
- 1707 Crockett St Unit A
- 1607 Houston Ave
- 1511 Crockett St Unit A
- 1511 Crockett St Unit B
- 1518 Houston Ave
- 1721 Shearn St
- 1508 Crockett St Unit C
- 1702 Shearn St
- 1807 Dart St
- 1609 Hickory St
- 1917 Summer St
- 1611 Spring St Unit C
- 1604 White St
- 1819 Dart St
- 1318 Bingham St
- 1406 Hickory St
- 1520 Colorado St
- 1514 Colorado St
- 1518 Colorado St
- 1516 Colorado St
- 1506 Colorado St
- 1602 Colorado St
- 1602 Colorado St
- 1602 Colorado St Unit A
- 1602A Colorado St Unit A
- 1705 Winter St
- 1613 Winter St
- 1517 Colorado St
- 1504 Colorado St
- 1616 Bingham St
- 1711 Winter
- 1511 Colorado St
- 1614 Bingham St
- 1521 Johnson St
- 1519 Johnson St
- 1612 Bingham St Unit A